


Don't want to trade it yourself?
Our desk runs DEX portfolios on profit share.
Currencies38596
Market Cap$ 2.28T+0.52%
24h Spot Volume$ 19.28B-1.68%
DominanceBTC56.51%-0.16%ETH10.12%+0.61%
ETH Gas0.08 Gwei
Ethereum (ETH) PriceETH Analysis
Aug 18, 2026
< 1min read
byShayan Markets
forCryptoPotato
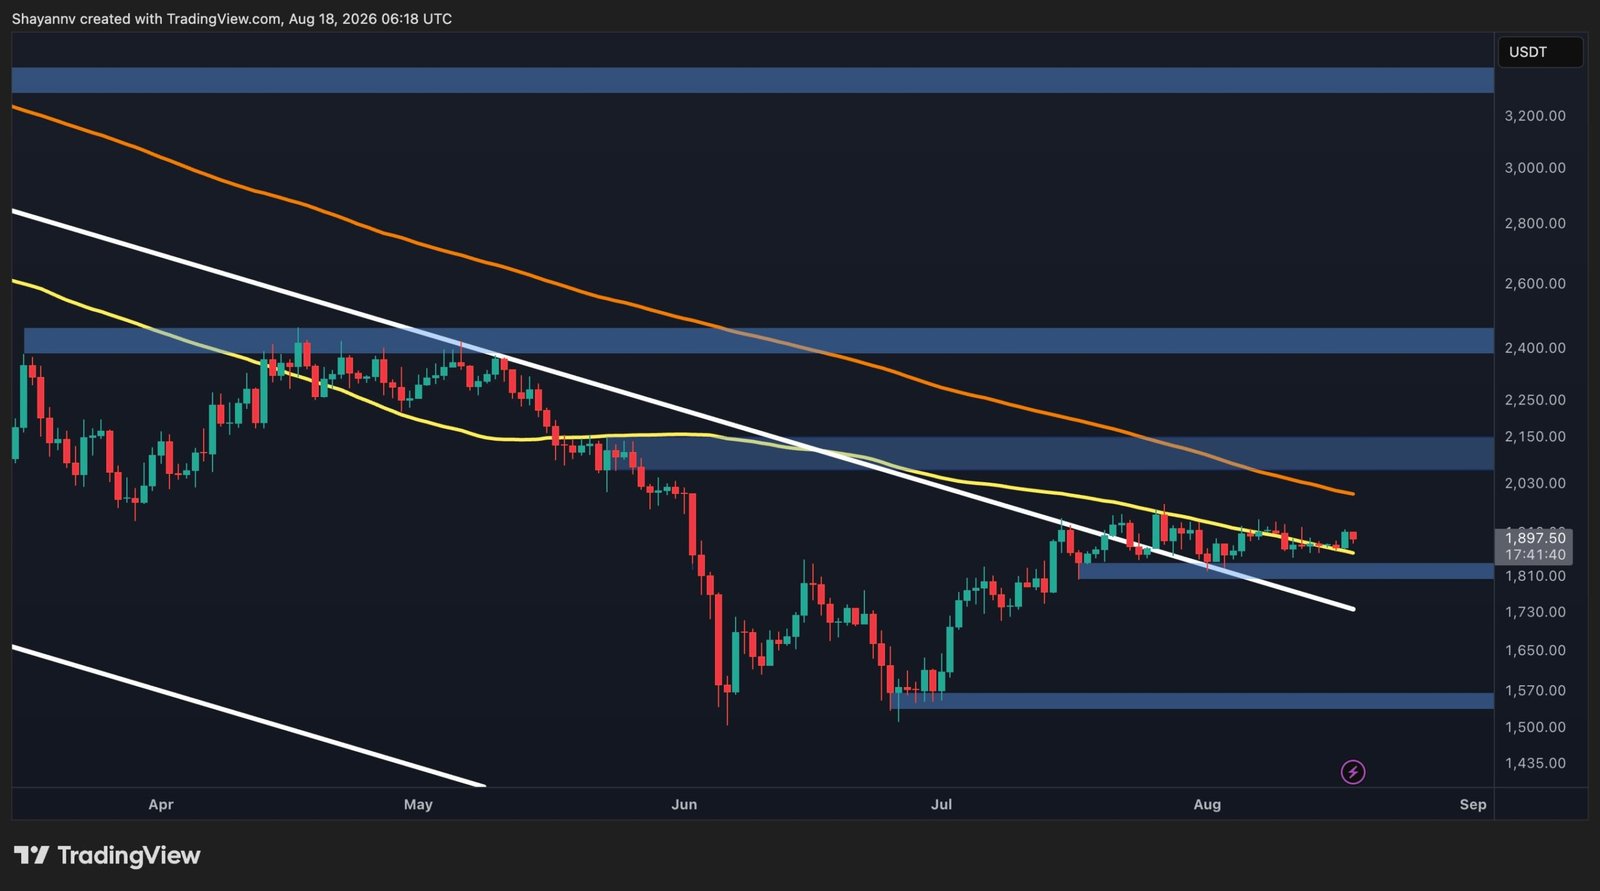
Ethereum is consolidating around $1.9K after a sharp recovery from June and July lows, trading between the $1.8K support zone and the $2.1K resistance area. Clearing $2.1K would break the 100-day and 200-day moving averages and could signal a new uptrend, while the improved structure leaves ETH at a key decision point for crypto markets, DeFi and exchange sentiment.
See what traders are focused on
Ethereum is consolidating around $1.9K after recovering sharply from the June and July lows. The broader structure has considerably improved, but ETH still remains below several important resistance levels, and at the moment, the market is at a key decision point.
Ethereum Price Analysis: The Daily Chart
The daily chart shows ETH trading around $1.9K, with the price currently caught between the 1.8K support zone and the $2.1K resistance area. The latter is particularly important because reaching it would mean that the market has broken past both the 100-day and 200-day moving averages and is ready to build a new uptrend.
Source: cryptorank.io