


Don't want to trade it yourself?
Our desk runs DEX portfolios on profit share.
The crypto market surged after President Trump urged Congress to pass the Clarity Act on August 20, 2026, pushing Ethereum price now to $2,405.51. The broader market cap climbed 5.66% to roughly $2.6 trillion, with sentiment firmly in Greed. Momentum and exhaustion sit side by side.
Key takeaways
- $ETH trades at $2,405.51 on August 21, 2026, after a broad market rally triggered by regulatory headlines.
- Daily RSI has reached 86.31, an extreme overbought reading that historically precedes a pause or pullback.
- The 1H MACD histogram has turned negative, signaling intraday momentum is already fading despite the bullish structure.
- Bitcoin dominance remains elevated at 59.44%, while $ETH holds an 11.05% share of total market cap.
- On-chain DEX activity shows mixed signals: Uniswap V4 fees surged 75.89% weekly, but Curve fees dropped 15.61% over the same period.
Daily Chart Shows Overbought Extremes for Ethereum
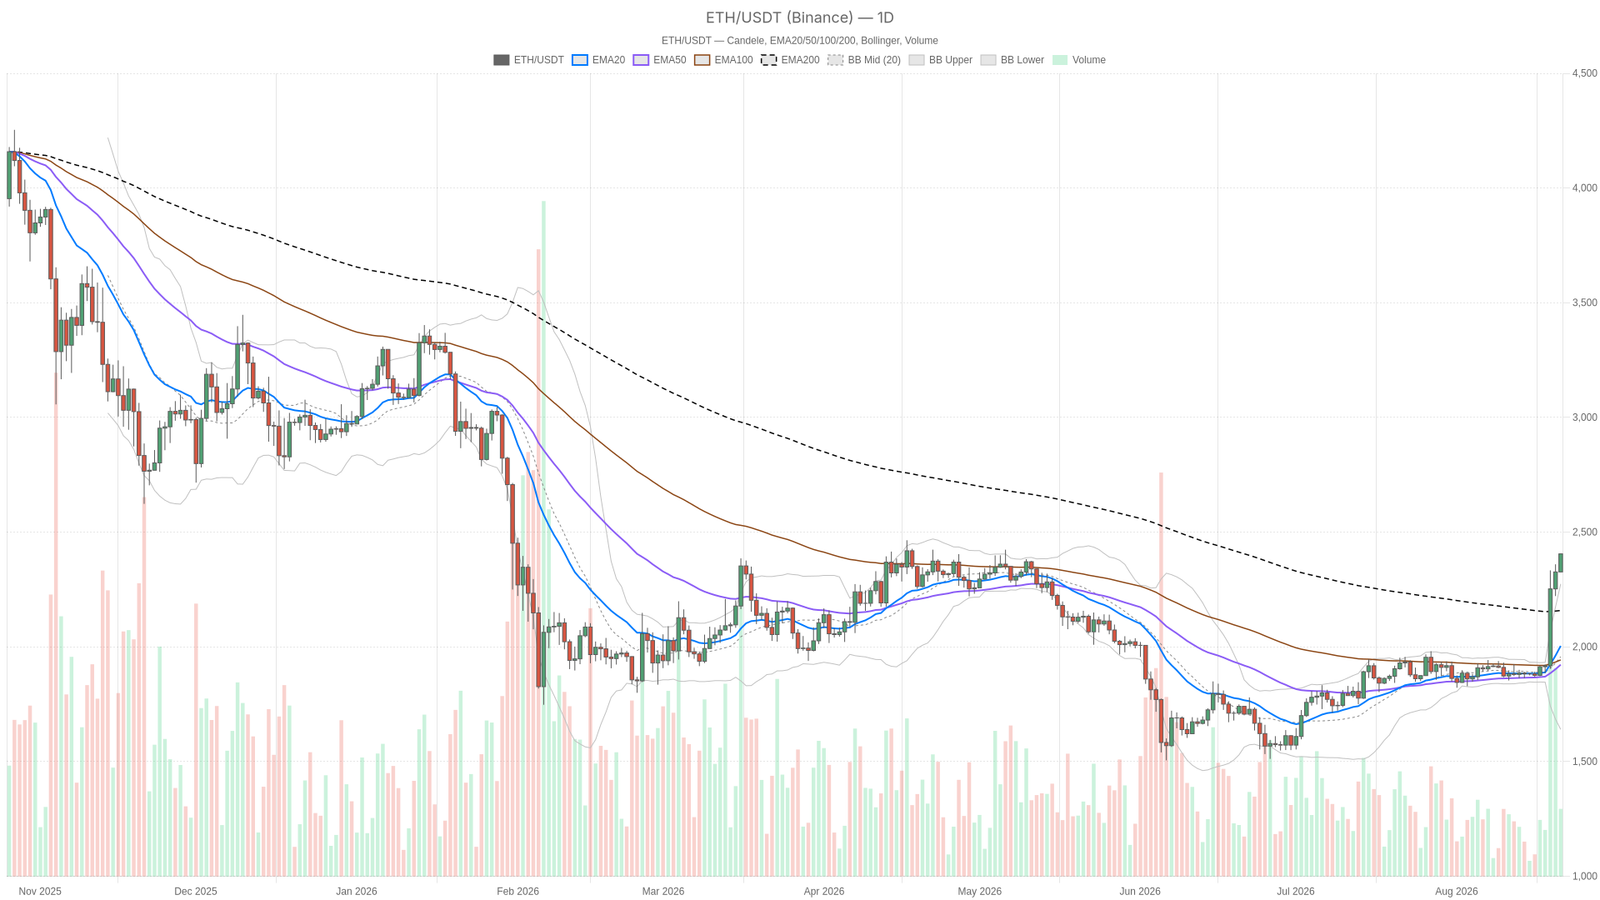
The daily chart confirms a bullish structure with price above all major moving averages, yet RSI at 86.31 signals the market is deeply overbought and vulnerable to a pullback. $ETH’s close at $2,405.51 sits comfortably above the 20 EMA at $2,004.41, the 50 EMA at $1,922.45, and the 200 EMA at $2,158.74. That stacking is textbook bullish structure, leaving no ambiguity about the macro trend direction.
However, the problem is how far price has stretched to get there. MACD remains constructive with the line at 92.66 above the signal at 40.22 and a histogram of 52.45, meaning momentum is expanding, not contracting. Yet expanding momentum from an already overbought base is exactly how blow-off moves behave before they stall. Price is also trading above the upper Bollinger Band at $2,274.59, confirming this is a stretched, high-volatility environment rather than a calm grind higher.
Daily ATR14 of 73.84 tells you the market moves roughly $74 a day on average, so a swing toward the pivot support at $2,351.25 would not be unusual noise. Resistance sits at the R1 pivot of $2,433.50, which lines up closely with the kind of move ATR alone could produce from here. The system’s daily regime read is tagged neutral despite the clearly bullish EMA stack, and that captures the tension perfectly: the trend is up, but the stretch caps conviction.
1H Chart Confirms Uptrend but Momentum Is Already Cooling
The 1-hour timeframe still supports the uptrend structurally, yet the MACD has already flipped bearish with a negative histogram, signaling intraday momentum is fading. EMAs are stacked bullishly, with the 20 EMA at 2,333.93, the 50 EMA at 2,235.69, and the 200 EMA at 2,032.59, while the regime is flagged bullish. However, RSI14 has come down to 78.11 from more extreme levels, and MACD shows the line at 41.95 dipping below the signal at 43.90, producing a negative histogram of -1.95.
That is a small but meaningful crack in the short-term picture. Price sits above the upper Bollinger Band at 2,397.49 versus a mid-band of 2,337.60, again flagging an extended condition rather than a stable one. The 1H pivot point is 2,394.49, with resistance at $2,418.74 and support at $2,381.74. ATR14 on the hourly is 24.11, so a full retest of the pivot support would not require an unusual move, just a normal hour or two of selling.
15-Minute Chart Provides Execution Context
The 15-minute chart shows RSI easing to 72.69, still elevated but no longer at extremes, with pivot resistance at $2,412.62 marking the level to watch for any continuation attempt. MACD remains positive with the line at 12.48 versus signal at 10.10 and a histogram of 2.38, which keeps the very short-term bias intact. That said, the histogram is thin compared to the daily reading, suggesting this leg lacks the same force behind it.
Meanwhile, price near $2,404.78 sits just under the upper Bollinger Band at 2,399.87 relative to a mid-band of 2,366.89. Support at $2,391.57 marks where dip-buyers would need to show up to keep the intraday structure intact. The compression between resistance and support on this timeframe suggests a breakout in either direction could come quickly.
Market Backdrop: Sentiment, Dominance, and On-Chain Signals
Bitcoin dominance at 59.44% and Fear & Greed at 72 confirm a risk-on environment, while on-chain DEX data from DefiLlama shows real activity picking up alongside the price move. Uniswap V4 fees are up 75.89% over seven days, Fluid DEX fees have climbed 135.32% over the same period, and Ekubo fees surged 209.68%. These are signs that genuine trading and liquidity activity are rising, not just speculative futures positioning.
Nevertheless, the on-chain picture is uneven rather than a uniform wave of demand. Curve DEX fees are down 15.61% over seven days and down 75.27% in the last 24 hours alone. Uniswap V3, meanwhile, saw a sharp 46.97% daily fee drop even after a 124.6% weekly gain, highlighting just how choppy and news-reactive this environment has become. Capital rotation into altcoins has not fully taken over the tape, with ether’s market cap share at just 11.05%.
Bullish Scenario
A hold above the 1H pivot support at $2,381.74 and a push through daily R1 at $2,433.50 would open the path toward genuine trend continuation. The clearest technical confirmation would come if the MACD histogram on the 1-hour re-expands into positive territory and RSI stabilizes rather than collapses. Moreover, a reclaim and hold above the 1H upper Bollinger Band at 2,397.49 as support rather than resistance would be the strongest tell that buyers remain in control. Continued strength in DEX fee data and any further regulatory tailwinds from the Clarity Act would support this scenario fundamentally.
Bearish / Mean-Reversion Scenario
On the flip side, a daily RSI at 86.31 rarely resolves cleanly upward without some retracement first, and the negative 1H MACD histogram is an early signal that a move toward the 1H 20 EMA at $2,333.93 may be brewing. A break below the 1H pivot point at 2,394.49, followed by a loss of the S1 support at $2,381.74, would open room toward the daily pivot point at $2,379.25. A deeper unwind could stretch toward the daily 20 EMA near $2,004.41, though that would require clear momentum deterioration across all three timeframes to justify.
What Would Invalidate Each Case
The bullish case weakens materially if price closes back below the 1H EMA20 at $2,333.93 or the daily pivot point at $2,379.25, signaling the current leg has lost its footing rather than simply pausing. Conversely, the bearish case is invalidated if $ETH reclaims and holds above the 1H R1 pivot at $2,418.74 with the MACD histogram flipping back positive, since that would show the pullback in momentum was temporary rather than the start of a real correction.
The Ethereum price now sits at a genuine crossroads between trend-following logic and mean-reversion risk. The daily chart says the bulls are in charge structurally, but RSI and Bollinger Band extension say this move has run hot. The 1-hour chart hints at hesitation even while its own trend structure stays intact. Daily ATR alone suggests moves of $70-plus in either direction would not be unusual. Conditions like this tend to resolve fast, one way or the other, and the discipline is in knowing which signal breaks first.
What is the current $ETH price?
As of August 21, 2026, Ethereum trades at $2,405.51 on the daily chart, following a broad market surge triggered by President Trump’s call for Congress to pass the crypto Clarity Act on August 20.
Is Ethereum overbought right now?
Yes, the daily RSI14 has reached 86.31, which is an extreme overbought reading. Additionally, price is trading above the upper Bollinger Band, confirming the market is in a stretched, high-volatility condition that historically precedes either a pause or a pullback.
What are the key support levels to watch for $ETH?
The immediate support to watch is the 1H pivot at $2,394.49, followed by S1 support at $2,381.74. Below that, the 1H 20 EMA at $2,333.93 and the daily pivot at $2,379.25 are the next key levels where buyers would need to step in to maintain the bullish structure.
Disclaimer: This article is for informational purposes only and does not constitute financial advice, an investment recommendation, or a solicitation to buy or sell any financial instrument or cryptocurrency. The analysis provided is not indicative of future results. Investing in crypto assets and financial markets carries a high risk of capital loss. Always do your own research (DYOR) and consult a qualified financial advisor before making any decision.
Article produced with the assistance of artificial intelligence and reviewed by the editorial team.
Source: cryptonews.net