


Don't want to trade it yourself?
Our desk runs DEX portfolios on profit share.
This late August surge and retreat brought renewed attention to a chart pattern in crypto. Traders often expect to see a Bitcoin Bart Simpson pattern after BTC▲$62,630.00 retraces from its parabolic rise, essentially trading sideways.
Bitcoin’s “Bart Simpson” Formation Is Back
However, that pattern has yet to form in the market. The current price action has mostly been consolidation rather than a sudden reversal.
BTC Rallied From $64,420 to Nearly $80,700
This move began around August 19, at which time Bitcoin was around $64,420 per bitcoin and peaked at around $78,300 on August 21 and $80,700 on August 25, a 25% move up in six days.
In that time, a total of $2.05 billion had flowed into US spot Bitcoin ETFs over six consecutive sessions, forcing a short-squeeze that lifted BTC back to $80,000 before the rally began to lose steam.
Why the August Rally Resembles a Bart Simpson Pattern
Bitcoin Bart Simpson pattern — similar to the cartoon character’s hairstyle — is a pattern wherein price goes up drastically, then trading laterally for a time, and drops back down drastically to the original value.
In Bitcoin’s case, it completed the first two parts: a low around $64,420 to a high near $80,700, as well as sideways to downward movement, but the reversal hasn’t happened. The emerging price structure has therefore fueled discussion of a possible crypto market Bart Simpson formation.
However, the shape is not a guarantee, as similar patterns can occur where the asset rises quickly but then consolidates without falling considerably.
Bitcoin Pulls Back Toward $77,000 as the Pattern Takes Shape
Bitcoin’s price came close to the $80,700 mark but lost some of its August gains. On September 2, BTC was reported to be at around $77,281 and consolidating near $77,500.
The retreat brings the Bart Simpson pattern crypto narrative more into focus but does not confirm the development of a full reversal. On the four-hour chart, the market has fallen into a period of stagnation rather than experiencing the quick drop representative of the pattern’s real end.
What Is the Bart Simpson Pattern in Crypto?
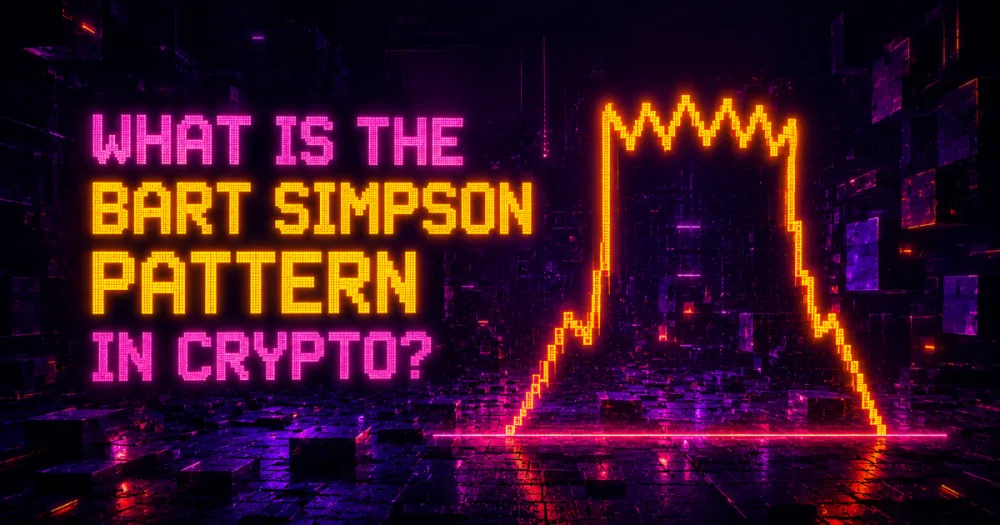
The crypto Bart Simpson pattern is not an official market technical indicator, but rather an informal chart pattern that consists of a sudden price jump, followed by a short period of sideways movement and a reversal of the price to the original level. The chart resembles Bart Simpson’s spiky hairstyle.
The structure has been known in the crypto trading community at least since 2015. There are bullish and bearish versions, with the latter — a rise, consolidation and sharp fall — currently seen around Bitcoin.
How the Sharp Rally, Consolidation and Reversal Pattern Forms
The Bart Simpson pattern in crypto typically consists of a steep price increase — or decrease — followed by sideways movement within a price range, followed again by a rapid movement back to the beginning of the price movement.
Speed is also important. A Bart reversal should appear quick looking similar to the initial spike. Likewise, a decrease of merely a few weeks is more reminiscent of a standard correction in lieu of a Bart reversal
Why Bitcoin Traders Watch the Pattern
The formation may also be closely monitored by traders due to the final leg indicating much of the move may be wiped away in a short period of time. The Bart pattern has also garnered attention during periods of low liquidity trading.
In 2022, CoinDesk reported that stop orders were triggered when Bitcoin produced the Bart pattern during a low liquidity Asian session.
For now, though, chart shape alone provides scant guidance. According to Decrypt, Bitcoin’s four-hour indicators are more consistent with a market that is stalling than a violent breakdown necessary to complete a Bart reversal.
Is the Bart Simpson Formation a Reliable Bearish Signal?
Bitcoin bearish pattern should not be viewed as a sell signal for traders because it is similar to other patterns that occur during normal consolidation after a large move up without another move lower.
That is an important distinction, though, because the Bart formation is only a market nickname, not a formal technical indicator or rule with an established mathematical formula or empirically proven trigger point, and confirmation only becomes apparent when the expected price behavior occurs.
| Bart Simpson Pattern Stage | Typical Price Action | What Traders Watch |
| Sharp move | Rapid price rise or decline | Speed, volume and liquidity |
| Consolidation | Sideways trading in a tight range | Range boundaries and momentum |
| Reversal | Fast move toward the starting price | Support or resistance breakdown |
| Confirmation | Initial move is largely retraced | Speed and depth of the reversal |
Why $75.8K Is the Key Bitcoin Support Level
The $75,800 level has since been observed to be a key technical level, with Bitcoin $75.8K support being the level separating consolidation from confirmation of the bearish Bart Simpson pattern.
What Happens if Bitcoin Holds $75,800?
BeInCrypto reports that if the level holds above $75,800, the bearish thesis will be invalidated, and BTC could retest the May high of $83,000.
This makes $75,800 one of the important Bitcoin support levels, but on its own, as a level, it is not enough for confirming the resumption of the uptrend. Resistance persists above the market.
A Breakdown Below $75.8K Could Confirm the Bearish Setup
Bearish speculation if BTC fails to hold above $75,800, with some analysts suggesting a bearish confirmation could occur below the $75,800 level.
But a drop in support does not guarantee a flash crash: for a Bart pattern to complete, the pullback must be as rapid as the preceding rally. A more gradual drop would resemble a typical Bitcoin price correction
Could BTC Fall Back Toward the $64K Area?
A drop back to $64,000 would mean that most of the August gains from around $64,420 to almost $80,700 would have been wiped. Mati Greenspan told CoinDesk that such a drop would need to be a sharp drop of at least 20% to complete the Bart formation, taking BTC back to that area.
$64,000 isn’t the only downside target being bandied about. Newmarket Trading’s Frank Hepworth estimates the downside at $70,000, but if selling picks up, $58,000 is also possible.
Meanwhile, Decrypt speculates that a move to around $62,000 could be an alternative explanation to the flash crash, thus needing a distinction between a swift turnaround and a prolonged decline in BTC price.
How Far Could Bitcoin Fall if the Pattern Is Confirmed?

If this formation is confirmed, the impending drop would have to be important — not just a standard number of retracement — to qualify. CoinDesk reports that Mati Greenspan, founder of Quantum Economics, said that for the Bart Simpson reversal pattern to be valid, there must be at least a 20% drop.
Such a move would be a materially deeper Bitcoin correction, but analysts have been uncertain whether it will actually happen. Increased liquidity, market depth and institutional interest have made clean Bart formations less common than in previous Bitcoin price history.
The 20% Correction Scenario
If Bitcoin’s market price were to decrease by 20% from August’s local high of just under $80,700, its market price would be right around the point where the August pump started. On August 19, Bitcoin was around $64,420; then it rose to $80,700 over the next six days
That’s why Bitcoin crash risk is not a small drop but a big retracement to the mid-$60,000s. However, Greenspan said he does not believe this will be the case for Bitcoin pattern.
$70K and $64K as Potential Downside Targets
Analysts are also watching for intermediate downside levels. New Market Trading chief executive Frank Hepworth told CoinDesk that Bitcoin could revert back down to $70,000 if it could not break above its 50-week moving average near $81,000 and could drop to $58,000 with further selling.
The $64,000 level is also relevant as it is the approximate start of the August rally, as well as being the level that corresponds to a 20% retracement from the all-time high. It should be seen as a possible scenario and not a target in Bitcoin technical analysis.
Why a Flash Crash Is Not the Only Bearish Scenario
A violent reversal does not have to be the only way lower; however, with the lower limit of Decrypt’s descending channel giving a price of roughly $62,000 for Bitcoin in eight weeks’ time, to the end of October.
As a result, this would result in a percentage loss comparable to a Bart-style crash but would be a traditional downtrend. Decrypt points out that for a Bart pattern to occur, there is a need for a rapid price drop below $75,800 and a forced liquidation event, rather than the leading lower highs and lower lows that have formed.
| Bitcoin Downside Scenario | Potential BTC Level | What It Would Mean |
| Initial bearish target | $70,000 | Intermediate support during a deeper pullback |
| 20% Bart reversal | ~$64,000-$64,500 | Retracement toward the start of the August rally |
| Gradual downtrend | ~$62,000 | Slower correction rather than a classic Bart reversal |
| Stronger sell-off | ~$58,000 | Deeper bearish scenario if selling pressure intensifies |
Bitcoin Technical Indicators Point to a Stalling Market
Sentiment is mixed, but Bitcoin’s short-term technicals are not overtly bearish. In fact, four-hour indicators are showing early signs of diminishing August rally momentum. Ignoring that, the overall structure hasn’t produced the necessary violent breakdown for the Bart Simpson formation to be confirmed, and the 50- period EMA is also above the 200- period EMA.
Market data provided another indication of this consolidation: Bitcoin has been unable to sustain above the $80,000 mark after crossing $81,000 in late August, as profit-taking has occurred at this level.
What the 4-Hour Chart Says About BTC Momentum
The RSI reading on the four-hour chart shows BTC at 44.8. While below the neutral level of 50, it is also above the sub-30 level, which generally indicates oversold conditions, meaning that BTC price analysis is at the mid-range, momentum is weaker, but the RSI indicator is not signaling an important crash.
Other shorter-term signals have also flipped to sell. For instance, following Bitcoin price rise from the mid-$60,000s, Bollinger Bands have compressed considerably, indicating a tighter trading range.
ADX Shows Limited Trend Strength
This was also reflected in the Average Directional Index, which, in a recent four-hour reading, was reading at a mild 22, which is below the benchmark 25 threshold for a trend.
In addition, other more recent analysis of the market shows the 4-hour ADX dipping to as low as 7, relative to above 80 at the breakout in August, which could certainly vary on timing and charting parameters, but both figures show a much weaker directional movement.
Trading Volume and Volatility Remain Critical
The volatility compression leads to the next breakout being a greater move. The Squeeze Momentum indicator is currently in a compression zone with bearish momentum decreasing. As the volatility increases, it is likely that a move will arise.
Similarly, demand conditions also matter for Bitcoin technical analysis as spot demand flipped into negative territory over the past two days but futures demand remained strong. The 30-day metric for long-term-holder distribution was 174,500 BTC on August 18 and rose to 281,900 BTC on August 28.
These numbers suggest that flows and fresh demand will play an important role in determining whether or not consolidation ends with recovery or further weakness.
Is the Crypto Market Following Bitcoin’s Bart Simpson Pattern?

XRP▲$1.13 and Ether also fell after surging in August. The total cryptocurrency market cap was around $2.59 trillion at the start of September.
However, this broader crypto market correction is not just limited to BTC, and not all of them will complete a Bart Simpson reversal.
XRP Shows a Similar Price Structure
Another example is XRP, which likewise went from $1 to $1.52, back down to $1.32, repeated that same process of growth and consolidation, then retraced back down again, leading Bitcoin and XRP to be recognized as potential Bart Simpsons.
Newmarket Trading’s Frank Hepworth thought XRP might retrace into a $0.55-$1.21 range if Bitcoin’s correction was extended, though it was still too early to confirm this pattern.
How Altcoins Could React to a Bitcoin Breakdown
Recent trading has also illustrated how Bitcoin weakness can coincide with weakness in the major altcoins; on 2 September, for example, BTC fell to as low as $77,000 amid declines in Ethereum, XRP and Solana.
However, altcoins started September at different technical levels, having already, during their August rally, outperformed Bitcoin, with XRP, ETH▲$1,761.17 and Solana all outperforming Bitcoin over one seven-day period in the month. Bitcoin dominance was near 59%. Moreover, a BTC break will not automatically imply a similar decline in the market as a whole.
Why Bitcoin’s Next Move Could Set the Tone for the Broader Crypto Market
Bitcoin is about 59% of the total cryptocurrency market by market capitalization as of late August. Bitcoin’s movements will therefore have a more pronounced effect on the total cryptocurrency market in this circumstance, especially with other major tokens already retreating.
The crypto Bart Simpson pattern currently is not bullish yet but a developing story. Bitcoin’s ability to form a bottom or to continue with the reversal will determine if the recent weakness in altcoins is a mere consolidation or the beginning of an extended sell-off.
What Could Invalidate Bitcoin’s Bearish Setup?
The bearish plan stays intact as long as Bitcoin price holds above $75,800 support. Meanwhile, Bitcoin price action above this level in the recent charts suggests an invalidation of the developing Bart Simpson pattern and an opportunity for buyers to revisit higher resistance.
Any continuation of the recovery may diminish the odds of a deeper Bitcoin correction in the near term. The question is whether buying can absorb profit taking and replace what had been gained in the second half of August.
Bitcoin Reclaims $80K
The $80,000 level thus emerged as a near-term battleground, with Bitcoin peaking at $81,326.81 in the process on 28 August before retracting back below the level amid sell pressure as bulls failed to hold a breakout.
A sustained move back above $80,000 would therefore improve the short-term structure. The $80,000-$81,000 area is the most meaningful Bitcoin resistance level as it was the upper end of the last Bitcoin rally before the subsequent pullback to the $77,000 level.
A Break Above the August High Could End the Bart Simpson Thesis
Even $80,000 might not invalidate this structure. BTC would have to cleanly break the high in late August and remain above it, rather than falling back after exceeding $81,000 as it did during the past week’s rally.
Furthermore, if bulls take over above $75,800, the May high of near $83,000 would be the next level to watch. In other words, the price could be propelled back to this level, or move above it, directly contradicting the potential reversal signaled by Bitcoin Bart Simpson formation.
Why Strong Spot Demand Could Prevent a Deeper Correction
Demand remains central to the bullish case with U.S. spot Bitcoin ETFs adding about $2.5 billion of new money over the seven trading days through Aug. 27, their best week since October. Institutional buying helped fuel the late August rally.
During Bitcoin range between August 18 and August 28, spot demand was weaker compared to futures demand, with two consecutive negative readings. Long-term holders’ distribution increased from 174,500 BTC to 281,900 BTC within 30 days between August 18 and August 28.
For that bullish case to play out, fresh spot demand would need to come in to soak up that extra supply. So flow data will be one test of whether Bitcoin can hold above support and retest its August highs.
| Bullish Invalidation Signal | Key BTC Level / Metric | Why It Matters |
| Support holds | $75,800 | Keeps the bearish setup from gaining confirmation |
| BTC reclaims resistance | $80,000-$81,000 | Improves the short-term price structure |
| August high breaks | Above ~$81,300 | Weakens the Bart Simpson reversal thesis |
| Higher resistance clears | Around $83,000 | Signals stronger bullish continuation |
| Spot demand strengthens | Rising ETF/spot inflows | Helps absorb supply and support the recovery |
Bitcoin Outlook: Correction or Continuation?

Bitcoin price hovered between weakening demand on short-term holders and an intact recovery structure at the start of September. It surged past $77,600 on September 3 after the active investor cost basis at $76,350 was defended by buyers. However, the recovery was not solid. The net outflow from spot Bitcoin ETFs was approximately $236 million, and stablecoin supply remained largely stagnant.
Therefore, the near-term Bitcoin price prediction is dependent on whether the market is able to hold the support area and buyers take control over the $80,000 region.
Bullish Scenario Above $75.8K
If BTC holds above $75,800, the Bart Simpson pattern under construction will not be confirmed. Short-term buyers also defended the current traders’ basis of around $76,350 as buyers helped BTC recover briefly after it slipped below that level.
Meanwhile, the upside remains to be seen, with $80,000 seen as a key near-term hurdle, while some technical analysis sees a daily close above $82,656 or thereabouts as a breakout level. This scenario would be improved with more buying volume.
Bearish Scenario Below $75.8K
A decisive loss of Bitcoin $75.8K support would strengthen the bearish case and potentially confirm the Bart Simpson setup. Note that for it to be a Bart, it has to reverse quickly, not slowly descending.
A downside risk can be seen by looking at derivatives market positioning where options hedging is concentrated around the $68,000 to $75,000 range. One technical scenario shows that a breach of support may lead to a gradual descent towards $62,000.
The Key BTC Levels to Watch Next
The first level to watch is $75,800-$76,350 where technical support meets the active investor’s cost basis. Above the market, first resistance comes in at $80,000, then up to the August highs of $80,700-$81,300 and into the low-$82,000s.
These Bitcoin resistance levels frame the continuation case, with the key level to watch for this bearish scenario around $75,800. Until then, BTC is likely headed for more of a consolidation with competing narratives rather than confirming either a larger move higher or a full-on Bart-like reversal.
Crypto Market Outlook After the Bart Simpson Warning

Bitcoin began September up around 25% month-on-month from August. Inflows to U.S. spot Bitcoin ETFs totaled $3.52 billion in September, the largest net inflow for a month so far in 2026, although these slowed early in the month after BTC briefly dipped under $77,000.
Accordingly, the Bart Simpson structure was a warning but not a reversal signal. The active-investors’ cost basis around $76,350 was defended, and BTC regained above $77,600 on 3 September.
What Bitcoin Traders Should Watch in September
Bitcoin September outlook factors include macroeconomic data and spot demand. The U.S. jobs report on September 4 may impact market expectations for the Federal Reserve’s September monetary policy meeting. ETF flows and stablecoin liquidity may also reflect spot demand and market trends.
In other news, bitcoin ETFs saw about $236 million in outflows, stablecoin supply was steadied at just over $310 billion, and around 3700 BTC had been added to exchanges over the past week. These signals do not support that spot-flow confirmation of the rally was reliable.
How BTC Support and Resistance Levels Could Shape the Next Trend
The $75,800-$76,350 zone is the key zone. Buyers defended levels above $76,350, and a close below $75,800 could trigger the next leg lower. Options positioning also hints at downside protection in the $68,000-$75,000 range.
Price action above the market level of $80,000 could face resistance. This is because nearly 8% of Bitcoin circulating supply was purchased between $80,000 and $82,000. These Bitcoin support levels and overhead supply zones define the immediate trading Bitcoin range.
Is the Current Setup a Warning or Just Another Bitcoin Consolidation?
With this data, the reversal was not yet confirmed. Spot demand was negative for two days and future demand remained strong. On 28 August, distribution by long-term holders reached 281,900 BTC (30-day moving average).
At the same time, Bitcoin’s recent recovery above $77,500 is a sign that the demand for BTC has not dried up; hence Bitcoin bearish pattern is thus only a potential risk scenario at the moment, which will be decided at the level of support and spot demand, in the $80,000-$82,000 range.
What Is a Bart Simpson Pattern in Bitcoin Trading?
The Bart Simpson pattern is an informal name for a chart pattern that is characterized by a rise, sideways movement, and drop, resembling the stylized hair of the cartoon character Bart Simpson.
Is Bitcoin’s Current Bart Simpson Pattern Confirmed?
No. The formation is not yet complete as Bitcoin has not exhibited the decisive downside reversal of trend characteristic of such formations. Price action remains on the verge of ordinary consolidation.
Why Is $75,800 Important for Bitcoin?
The $75,800 area is a key near-term support level within the current market structure. A bounce and hold higher here would strongly indicate a weak bearish structure, whereas a clean breakdown at this level would tilt the odds toward further downside.
How Low Could Bitcoin Fall if the Pattern Completes?
If the August rally were fully retraced, Bitcoin could go as low as the mid-$60,000 region, but it may find some support at the $70,000 level.
What Would Invalidate the Bearish Bitcoin Setup?
A sustained reclaim above $80,000 would invalidate the bearish thesis, and a breakout of the August high would offer added validation. However, strong demand from spot markets would also be required to support the bullish thesis.
Source: bitcoinfoundation.org