


Don't want to trade it yourself?
Our desk runs DEX portfolios on profit share.
ArticlesClassGlossaryVideos
Intermediate
Crypto Market Analysis Today: Bitcoin Ownership Among Small Investors Continues to Rise, Is the Bear Market Over?
Update 7 Sep 2026 • Reading Time 8 Minute
Reading Time:8minutes
Spot Bitcoin ETFs absorbed $986.85 million in net inflows over the past week, pushing their assets under management past $100 billion the US employment report released on 4 September recorded 162,000 new jobs, close to three times the consensus estimate, and revived the prospect of an interest rate increase. This weekly market analysis covers market conditions, macroeconomic factors, technical levels, and institutional capital flows
Article Summary
- 📊 Bitcoin rose 2.52% over 7 days to $79,622.12, although the gain has yet to break through its nearest resistance.
- 📈 The US 10-year Treasury yield climbed to 4.79% and the dollar index to 99.04, while the probability of a rate increase at the Fed meeting reached 63% according to Charles Schwab.
- 🏦 Spot Bitcoin ETFs absorbed $986.85 million over the week and their assets under management crossed $101.25 billion.
- 💼 Since 2022, Bitcoin ownership among small investors has continued to rise, while early 2026 showed a shift in ownership from Sharks to Whales that indicates supply consolidation.
- 🔐 Liquid Network halted network activity after roughly 4,000 BTC worth $320 million were withdrawn from its federation wallet.
Market Conditions This Week (7 September)
Fear and Greed Index CoinMarketCap: 74 (Greed).
Bitcoin and Solana now sit less than 3.2% away from resistance, while Ethereum remains a double-digit distance behind. All three are waiting on the same catalyst, but from different positions. Unlike the 21% rally on 24 August, prices this time were close to flat even as ETF inflows continued, which indicates that institutional buyers absorbed the selling pressure.
Macroeconomic Analysis: The August Employment Report Revives the Prospect of a Rate Increase
The Bureau of Labor Statistics recorded 162,000 new nonfarm jobs in August, roughly three times above consensus, with unemployment at 4.1% and wage growth of 3.1% year on year. Revisions for June and July were also raised, changing the earlier picture of a weakening labor market.
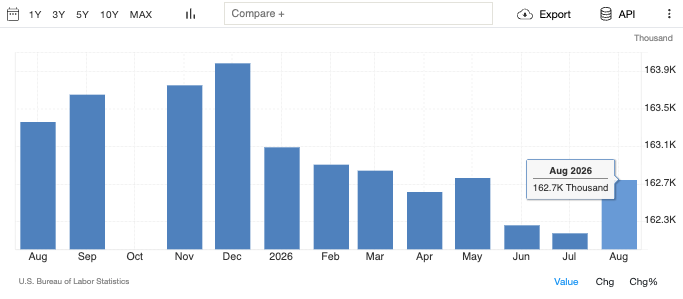
The 10-year Treasury yield rose to 4.79%, the two-year to 4.37%, and the dollar closed at 99.04, while the probability of a 25 bps rate increase in September jumped to 63%. However, consumer sentiment at 51.7 and retail sales at -0.6% show that consumption remains weak. As a result, the inflation data due on 11 September will determine whether the Fed does in fact tighten policy.
Learn more about How to Buy and Invest in Bitcoin 2026 on Pintu Academy to understand the ideal timing for making an investment.
US Macroeconomic Calendar
Crypto Market Analysis Today: BTC, ETH, and SOL Technicals
BTC: Price Holds Above the 61.80% Fibonacci Level and Tests Resistance at $82,129.4
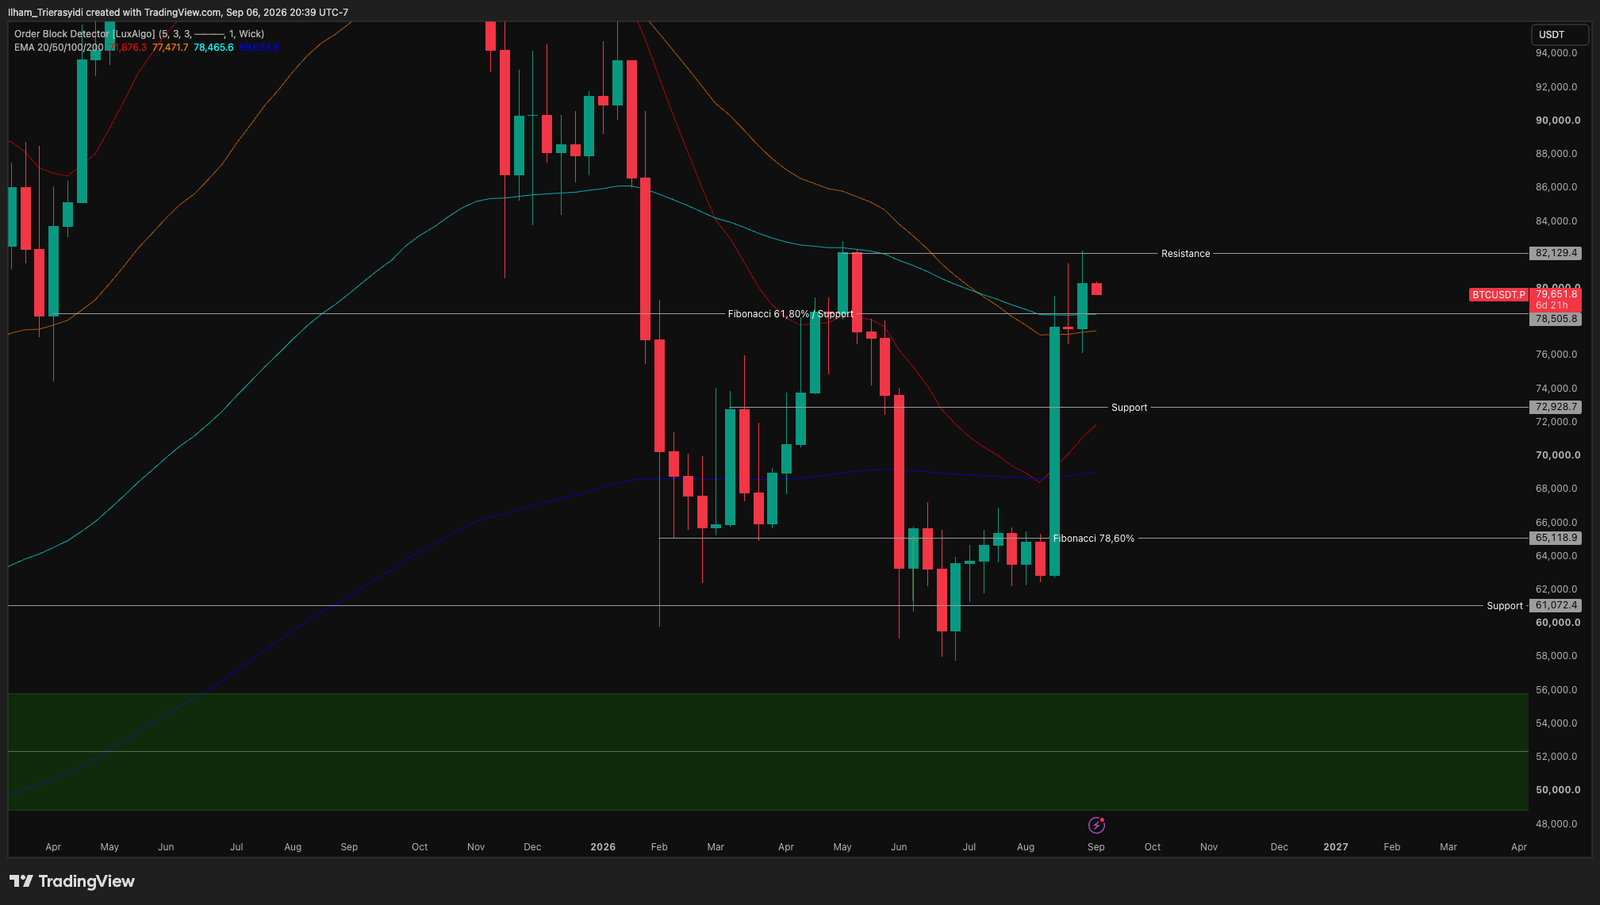
BTC managed to hold the 61.80% Fibonacci level at $78,505.8, which in the previous week had still acted as resistance. It now sits above the 50 EMA at $77,471.7 and the 100 EMA at $78,465.6, two lines that stayed above price throughout the first half of this year. That change in the role of the level is the most important part of its weekly structure.
- Nearest resistance: $82,129.4, a marker that has not been broken since price fell from the December 2025 peak.
- Nearest support: $78,505.8, the 61.80% Fibonacci level that now coincides with the 100 EMA.
ETH: The $2,371.69 Reclaim Holds but Price Remains Below the 100 EMA
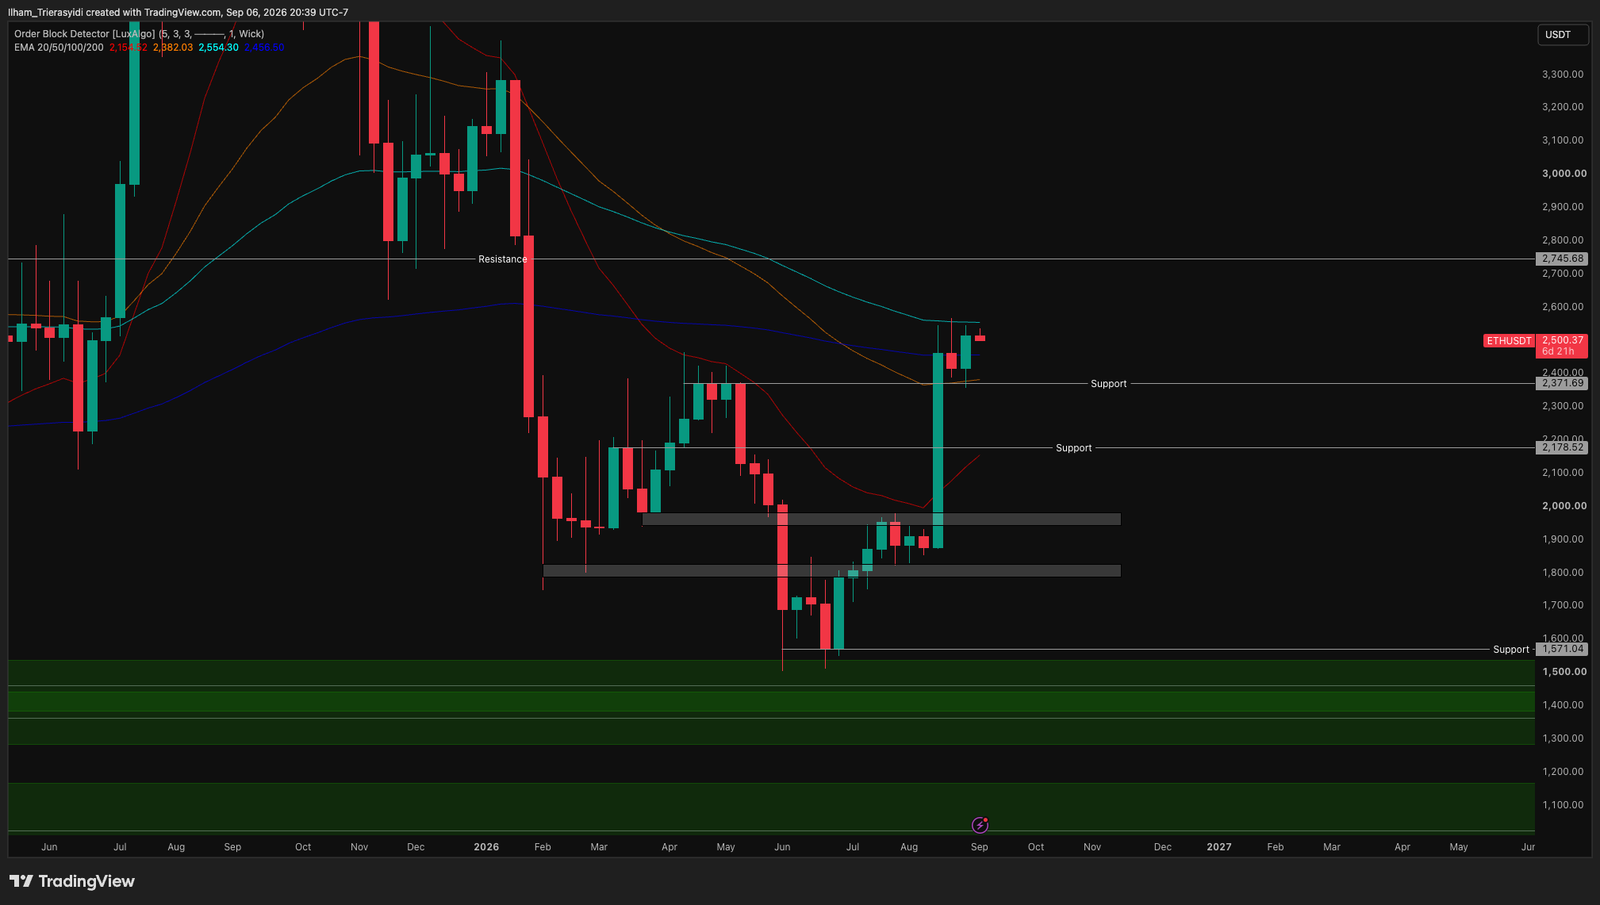
ETH is currently still trading above the $2,371.69 level, which in mid-August changed from resistance into support. On the upside, price is caught between the 200 EMA at $2,458.50 and the 100 EMA at $2,554.30, making these two moving averages the nearest hurdles that need to be cleared. If it manages to move past them, the next resistance sits at $2,745.68, the level that last capped a price advance in early 2026.
- Nearest resistance: $2,554.30, the position of the 100 EMA sitting just above price
- Nearest support: $2,371.69, the level that has held price since it was reclaimed in mid-August.
SOL: Price Held Below Resistance at $105.95 and Sitting on the 50 EMA
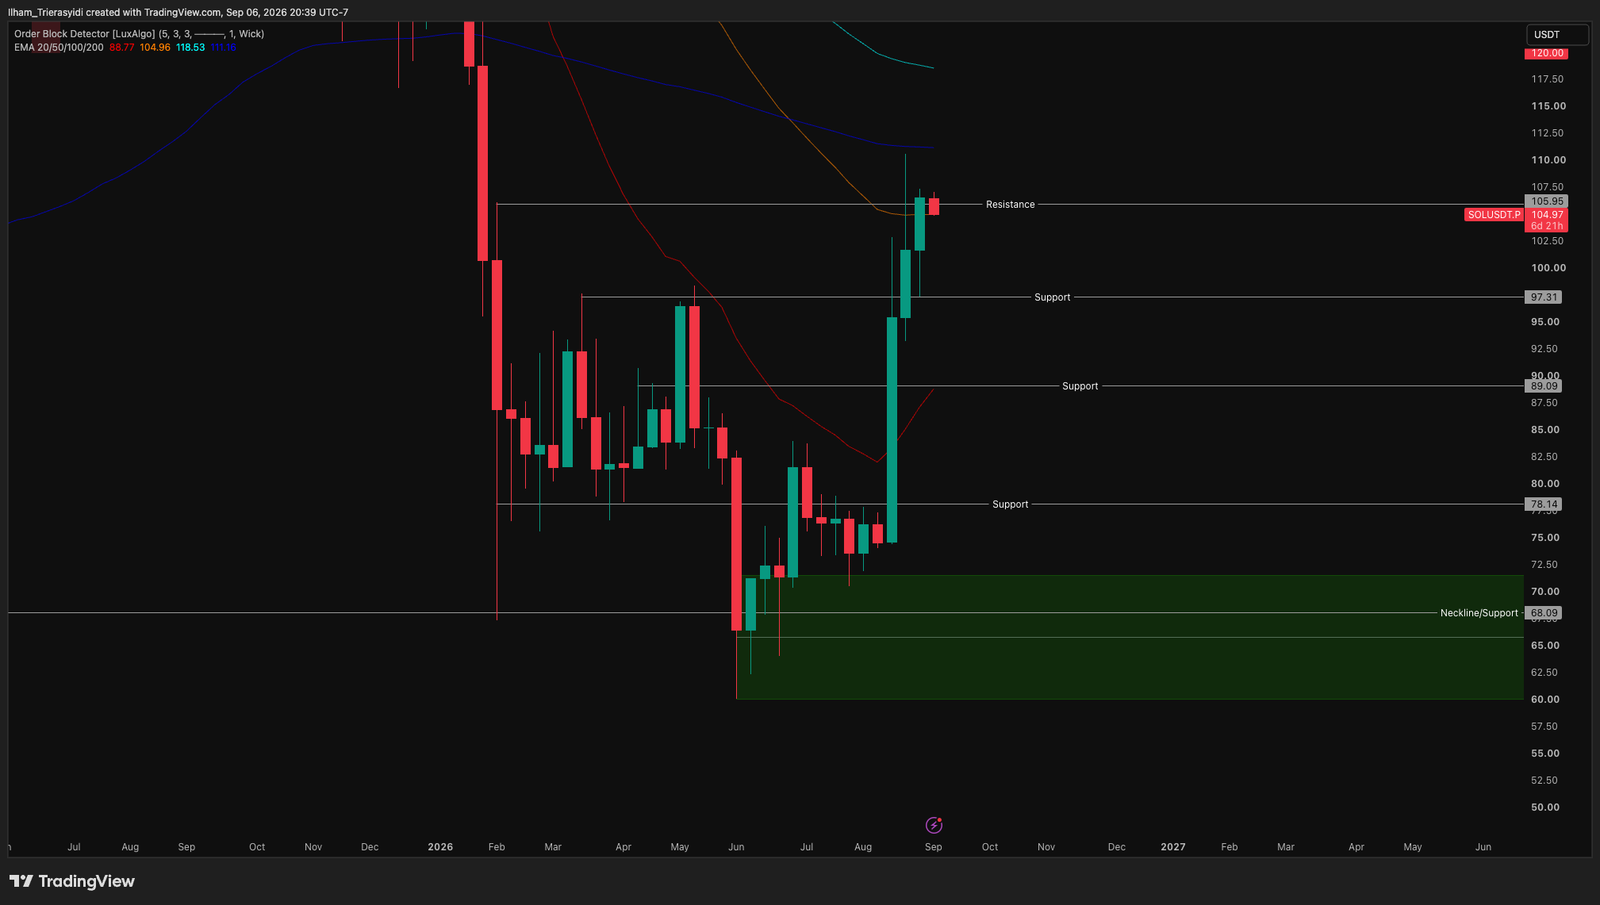
SOL is at $104.97 after clearing two support levels over the past two weeks, at $89.09 and $97.31. Price is now almost exactly on the 50 EMA at $104.96, while the nearest resistance at $105.95 sits in the same area. If it manages to break through this zone, SOL still has to contend with the 200 EMA at $111.16 and the 100 EMA at $118.53, so any further advance will meet several resistance levels in sequence.
- Nearest resistance: $105.95, which coincides with the 50 EMA at $104.96.
- Next resistance: $111.16 to $118.53, the range between the 200 EMA and the 100 EMA.
- Nearest support: $97.31, the level reclaimed last week.
On-Chain Data and Institutional Capital Flows
Spot ETF Flows
Spot Bitcoin ETFs recorded $986.85 million in net inflows through 4 September, up from $924.48 million the previous week and marking a third consecutive positive week. AUM rose to $101.25 billion, with cumulative flows since launch reaching $55.62 billion.
BlackRock contributed roughly $691.5 million, with the strongest flow occurring on 3 September after remarks by Fed Governor Christopher Waller pushed expectations toward looser policy.
On-Chain Data
This chart divides Bitcoin supply into seven wallet groups, from Shrimp (under 1 BTC) through to MegaWhales and Exchanges (above 10,000 BTC). Two patterns stand out. Holdings among Shrimp and Crabs (1 to 10 BTC) have widened steadily since January 2022, pointing to growth in retail holders who are relatively resistant to price cycles. Meanwhile, early 2026 shows a shift from Sharks (100 to 1,000 BTC) to Whales (1,000 to 10,000 BTC), which indicates a consolidation of ownership without a meaningful change in total supply.
Learn more about What Is Asset Tokenization on Pintu Academy to understand the various types of assets and how they work.
Key Crypto News of the Week
- Liquid Network halted network activity: Around 4,000 BTC worth $320 million were withdrawn from the Liquid Network federation wallet using the Peg-out Authorization Key. The parties claiming responsibility described themselves as white hats and stated that the keys were not compromised, but the network was still halted and several exchanges suspended LBTC withdrawals.
- Coinbase filed for stock perpetual futures with the SEC: The filing still awaits CFTC approval and follows an earlier authorization for perpetual crypto asset contracts. If it clears, stock derivatives using a perpetual mechanism will enter licensed US crypto exchanges.
- Banco do Brasil purchased $5 million in tokenized structured notes issued by Citigroup: The instrument will be issued through the D-FMI platform owned by Euroclear and marks the first purchase of its kind by a Latin American financial institution.
Learn more about Altcoin Analysis for the Next Bull Market on Pintu Academy, covering everything from sector rotation to notable catalysts with the potential to move prices.
Best and Worst Performing Crypto Assets Over the Past Week
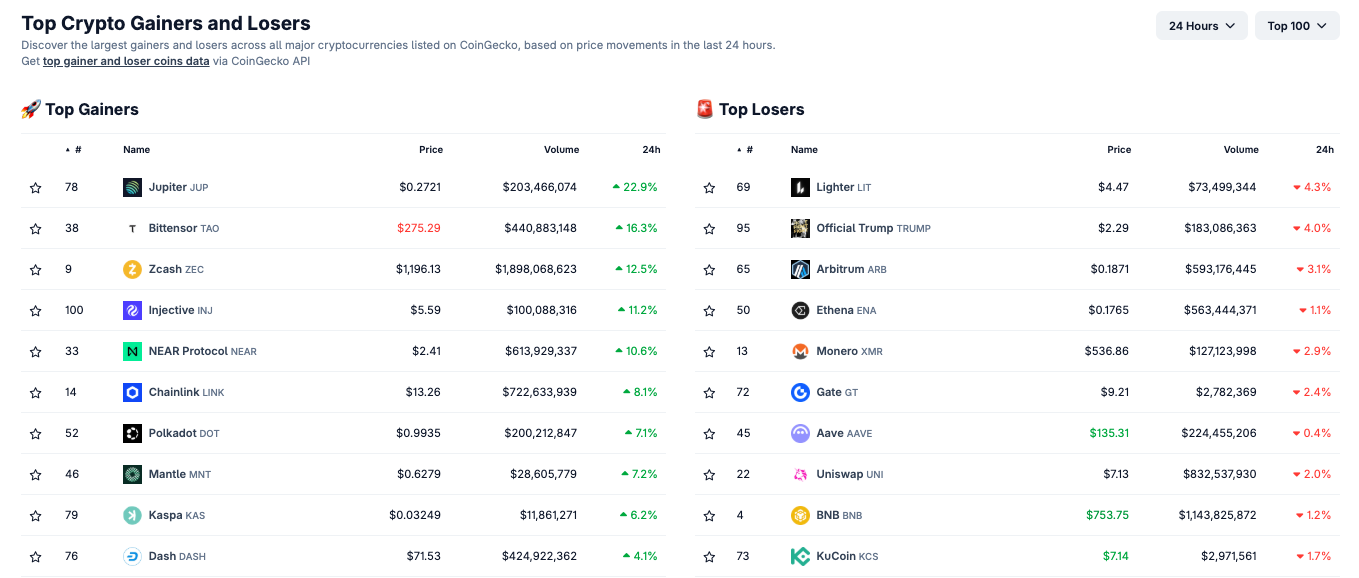
Period of seven days through 7 September 2026, among the 100 assets with the largest market capitalization, per CoinGecko data.
- Arbitrum up 120.4%
- Dash (DASH) up 73.1%
- Zcash up 44.6%
- Uniswap up 39.6%
- Pump.fun (PUMP) down 10.3%
- Canton (CC) down 4.6%
- LEO Token down 3.9%
- Official Trump down 2.3%
Disclaimer
All information presented in this article is compiled for educational and general informational purposes. This content is not intended as investment advice, a recommendation, an invitation to buy or sell any particular crypto asset, or a basis for financial decision making. Every investment decision rests entirely with the reader, taking into account their own financial position, investment objectives, and risk tolerance.
Frequently Asked Questions (FAQ)
Why is the Bitcoin price stagnant despite large ETF inflows?
ETF inflows measure net purchases from only one group of buyers. When price does not move even as inflows continue, another group is selling an equivalent amount, for example long-term holders locking in gains. The figure is useful for reading institutional interest, and less useful for estimating short-term price direction.
What effect does a Fed rate increase have on crypto asset prices?
Higher interest rates make risk-free instruments such as US government bonds more attractive, so capital tends to move away from risk assets, and a stronger dollar weighs on the price of dollar-denominated assets. The relationship is not always direct, because markets usually move ahead of the decision based on expectations.
What do the support and resistance levels in this technical analysis mean?
Support is a price area where demand was once strong enough to halt a decline, while resistance is an area where selling pressure was once strong enough to halt an advance. The levels in this article are read from weekly charts as areas to watch, and they do not guarantee that price will reverse at the same point.
Why did altcoins rise much more than Bitcoin this week?
When Bitcoin moves sideways within a narrow range, speculative capital often rotates into smaller-capitalization assets because the potential move is larger. The risk is also larger, because declines are usually just as fast once market attention turns back to Bitcoin.
How Do You Invest on Pintu?
On Pintu, buying crypto assets can start from a very affordable amount, namely from Rp11,000. Here is the easy way to buy crypto assets on Pintu:
- Go to the Pintu homepage.
- Open the Market page.
- Search for and select a crypto asset from the available categories.
- Enter the amount you want to buy, then follow the remaining steps.
Download the Pintu crypto app on the Play Store and App Store. Your security is assured because Pintu is licensed and supervised by the Indonesian Financial Services Authority (OJK) and CFX.
References
- CoinMarketCap, “Cryptocurrency Prices, Charts And Market Capitalizations“, CoinMarketCap, data as of 7 September 2026.
- Bureau of Labor Statistics, “Employment Situation Summary, August 2026“, U.S. Department of Labor, accessed on 7 September 2026.
- Trading Economics, “United States 10 Year Government Bond Yield“, Trading Economics, data as of 4 September 2026.
- Charles Schwab, “Stock Market Update“, Charles Schwab, accessed on 7 September 2026.
- J.P. Morgan via Chase, “A 25-Basis-Point Move Is Now Expected“, Chase Learning and Insights, accessed on 7 September 2026.
- SoSoValue, “Ethereum Spot ETF Dashboard“, SoSoValue, data as of 4 September 2026.
- SoSoValue, “Bitcoin Spot ETF Dashboard“, SoSoValue, data as of 4 September 2026.
- CoinGecko, “Top Crypto Gainers and Losers“, CoinGecko, data as of 7 September 2026.
Related Article
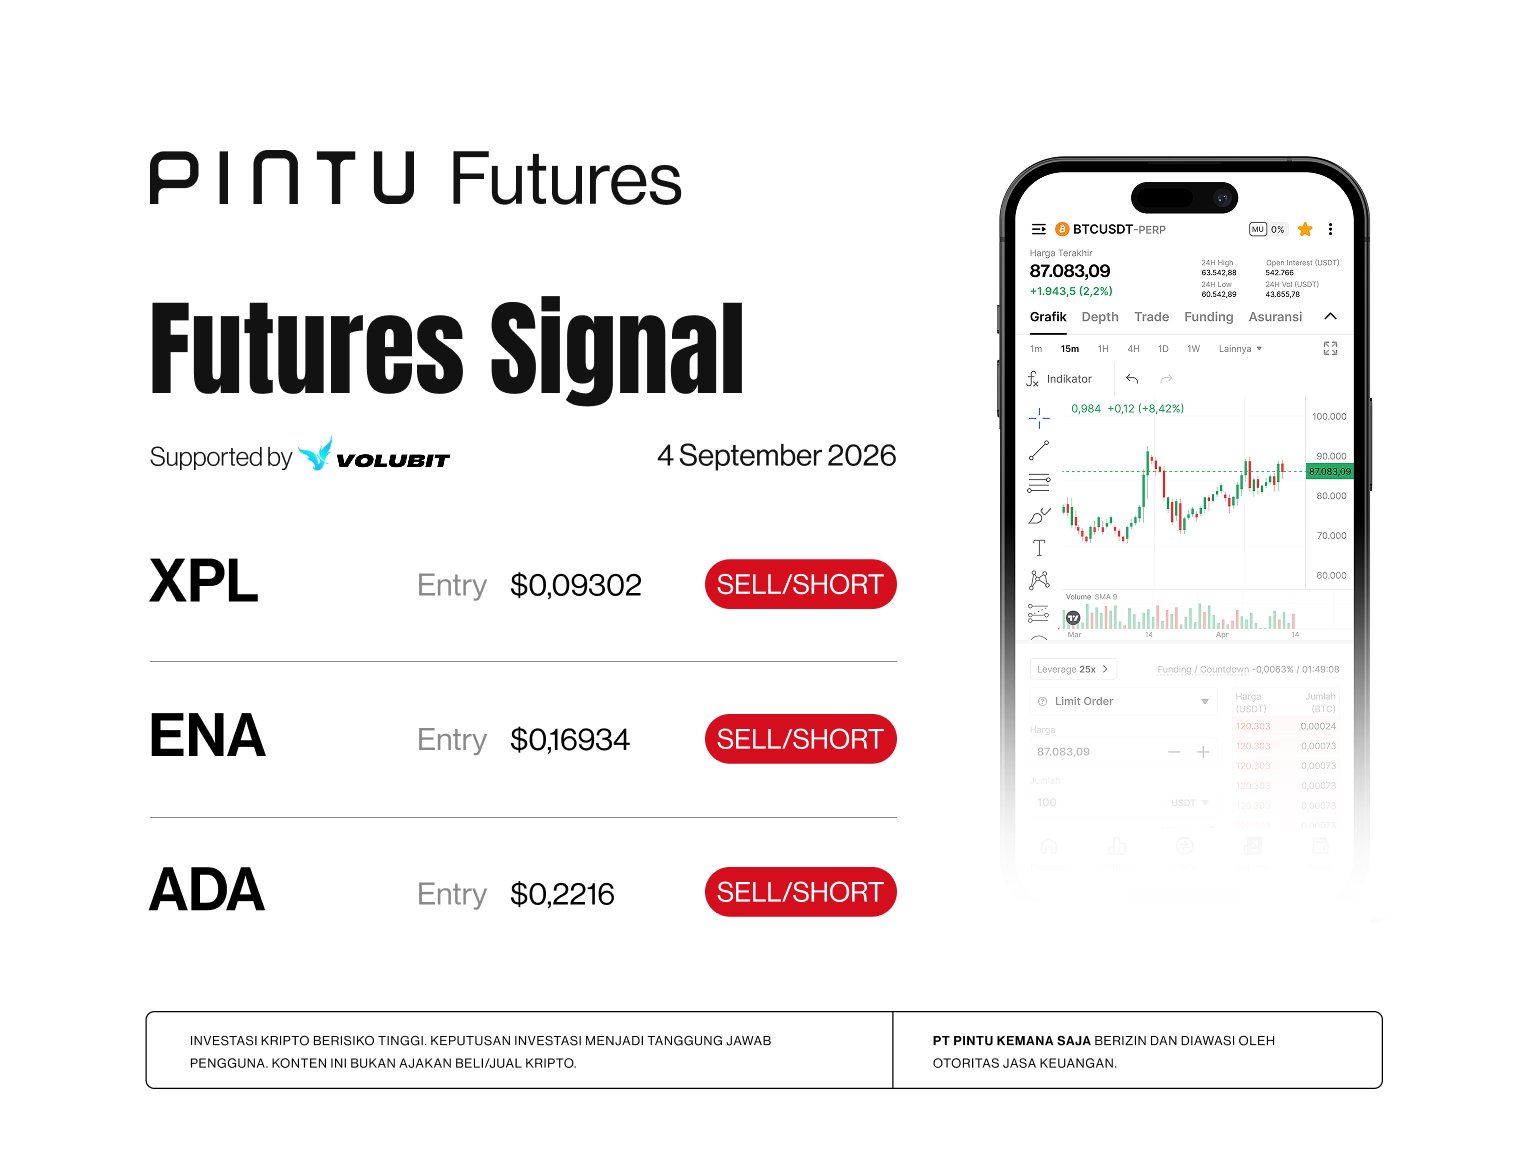
Crypto Futures Signal Pintu X Volubit, Friday, September 4, 2026
Crypto Market Analysis Today: Bitcoin Rally Stalls at $81K

How to Buy and Invest in Bitcoin in 2026: Making the Most of Bear Market Momentum
UNI
->
ZEC
->
ARB
->
TRUMP
->
LEO
->
Source: pintu.co.id