


Don't want to trade it yourself?
Our desk runs DEX portfolios on profit share.
-
Buy the BTC/USD pair and set a take-profit at 82,000.
-
Add a stop-loss at 76,000.
-
Timeline: 1-2 days.
-
Sell the BTC/USD pair and set a take-profit at 76,000.
-
Add a stop-loss at 82,000.
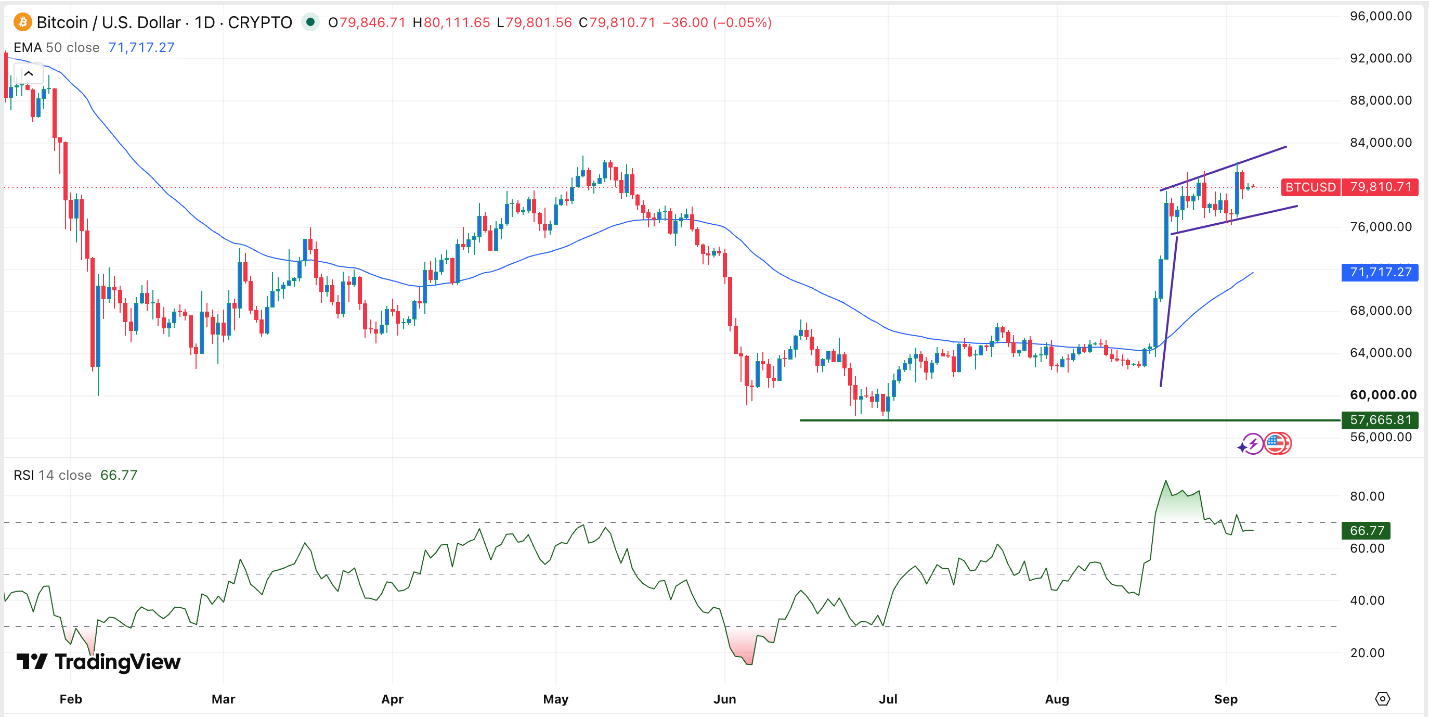
<a href="https://xpertsstudio.com/bitcoin-trails-gold-by-10x-and-cz-thinks-that-ends-next-cycle/” title=”Bitcoin Trails Gold By 10X, And CZ Thinks That Ends Next Cycle”>Bitcoin price wavered below the important resistance level of $80,000 as the recent consolidation continued. The BTC/USD pair was trading at 79,895, a few points below this month’s high of 82,152. This price is about 40% above its lowest level this year.
Bitcoin ETF Inflows are Rising
The ongoing Bitcoin consolidation is happening even as accumulation by American investors continue. Data shows that these investors bought ETFs worth $770 million in the first four dats of the month, continuing a streak that started in August, when inflows soared to $3.5 billion. The funds, led by BlackRock’s IBIT, now hold over $101 billion in assets under management.
1
Get Started74% of retail CFD accounts lose moneyRead Review
Higher Bitcoin ETF inflows is a sign that top investors, including institutional ones, have continued their accumulation. They likely expect that the coin will continue rising in the foreseeable future.
At the same time, some prominent investors have continued accumulating Bitcoin holdings. Strategy bought Bitcoin at the end of last month, and Michael Saylor has hinted that the company bought more last week. Strive, a company associated with Vivek Ramaswamy, has also continued buying these coins.
Bitcoin wavered after the Bureau of Labor Statistics (BLS) released a stronger-than-expected jobs report. The nonfarm payrolls (NFP) jumped sharply in August, beating analysts’ estimates by far. It created over 162k jobs, higher than the expected 60k.
The strong jobs numbers, coupled with the elevated inflation, means that the Fed will likely start hiking interest rates this month. This view will be confirmed if the US publishes a higher-than-expected consumer inflation report on Friday. Inflation has remained stubbornly high this year because of Trump’s tariffs and the ongoing US-Iran war.
BTC/USD Technical Analysis
The daily chart shows that the BTC/USD pair has remained inside a narrow range in the past few days. It has formed an ascending channel, which formed after it had a parabolic move in August this year. Bitcoin is forming a bullish flag pattern and has remained above the 50-day moving average.
The risk, however, is that the Relative Strength Index (RSI) has dropped from the overbought level of 85 to the current 66. That could be a sign that it is forming a bearish divergence pattern, which normally leads to a reversal. Therefore, the next key support and resistance levels to watch will be at 76,000 and 82,000.
Ready to trade our daily Forex signals? Here’s a list of some of the best crypto brokers to check out.
Source: www.dailyforex.com