


Don't want to trade it yourself?
Our desk runs DEX portfolios on profit share.
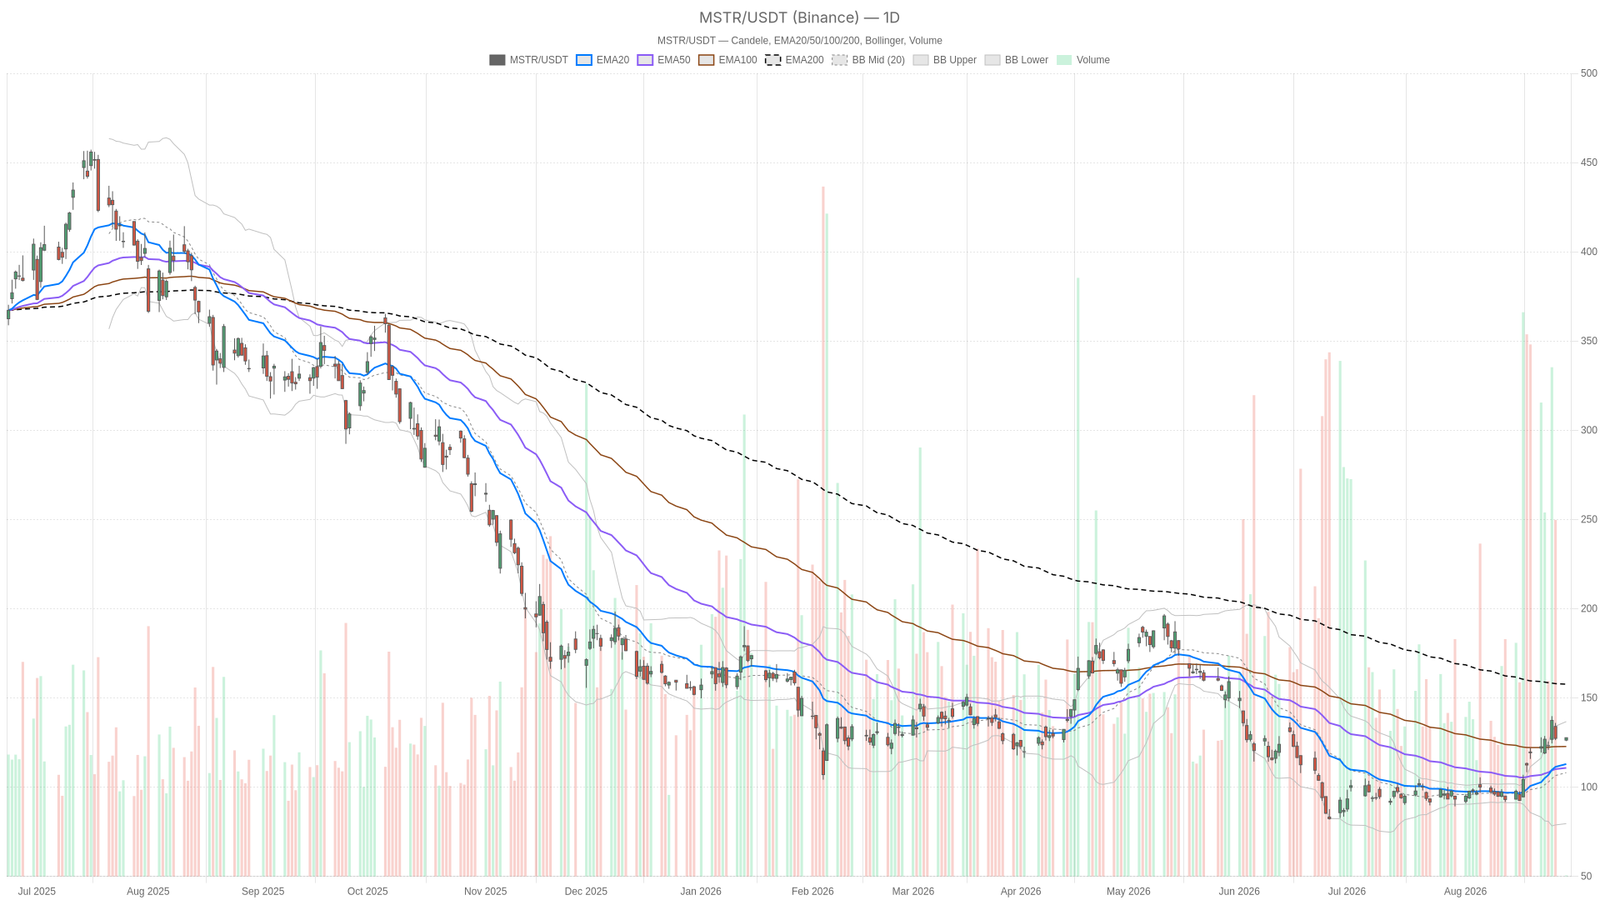
Strategy stock closed at $127.69, extending a multi-week recovery driven by the company’s $370 million Bitcoin purchase last week. Daily momentum indicators are turning constructive. However, the stock remains far below its 200-day moving average, complicating the bullish narrative.
Key takeaways
- Strategy stock closed at $127.69, above both the 20-day EMA ($112.92) and 50-day EMA ($110.77).
- The daily RSI reads 63.25, signaling buyers remain in control with room before overbought territory.
- Hourly MACD has turned negative, directly conflicting with the bullish daily momentum signal.
- The company bought $370 million of Bitcoin last week, reinforcing MSTR’s tight correlation to crypto markets.
- Tight 15-minute Bollinger Bands suggest an imminent volatility squeeze that could trigger a sharp directional breakout.
Strategy Stock Daily Trend: Bulls Regain Control, With Caveats
The daily chart <a href="https://xpertsstudio.com/xrp-price-faces-heavy-selling-at-1-35-support-can-it-hold/” title=”XRP Price Faces Heavy Selling At $1.35 Support: Can it Hold?”>supports a bullish bias, with Strategy stock trading above key short-term moving averages. However, the 200-day EMA at $157.67 remains far above current price. The broader trend has not yet turned. This looks like a recovery bounce inside a larger downtrend rather than a breakout to new highs.
On the daily timeframe, MSTR closed at $127.69. It sits above the 20-day EMA at $112.92 and the 50-day EMA at $110.77. That alignment points to a short-to-medium-term uptrend gaining traction. Yet the 200-day EMA sits far above, meaning the broader structure is still recovering from a deep decline.
Daily Momentum Indicators Confirm Bullish Pressure
The daily RSI reads 63.25, comfortably above the neutral 50 line without reaching overbought territory. Buyers remain in control with room left before the rally becomes stretched.
The daily MACD line at 7.91 remains above its signal line at 4.63, producing a positive histogram of 3.29. This confirms a clean bullish momentum signal aligned with the EMA structure. Meanwhile, the daily Bollinger mid-band sits at $108.12. Price trades well above it and below the upper band at $136.72. That leaves room for further upside before the bands begin capping the rally.
Volatility Context and Pivot Levels
The daily ATR14 stands at 7.99, a hefty figure relative to price. It underscores MSTR’s typical outsized swings tied to Bitcoin’s own volatility. The lower Bollinger band at $79.52 shows just how wide the recent range has been.
The daily pivot point sits at $127.08, with resistance at $128.37 and support at $126.40. Price hovers right at that pivot, a zone that often dictates short-term direction. Notably, the system’s regime reading remains neutral. The broader trend has not fully confirmed a reversal.
Hourly Chart Complicates the Bullish Case for Strategy Stock
The 1-hour chart paints a more cautious picture. A bearish MACD crossover directly conflicts with the daily bullish signal. Strategy stock faces near-term consolidation rather than a clean continuation.
On this timeframe, price at $127.69 trades just below the 20-period EMA of $128.88. It remains above the 50-EMA at $123.52 and the 200-EMA at $107.64. That mixed EMA stack suggests short-term cooling rather than a clean trend.
The hourly RSI at 49.34 sits almost exactly at the midpoint. Intraday momentum has faded after the recent push higher. In contrast to the daily reading, the hourly MACD line at 0.89 sits below its signal at 2.15. The histogram reads -1.26. This negative crossover suggests the rally is losing steam on a shorter-term basis.
The hourly Bollinger mid-band is at $130.43. Price trades below it, between the upper band of $141.56 and the lower band of $119.29. That positioning hints the move has pulled back after testing higher levels. The hourly pivot at $127.28 mirrors the daily pivot closely, with resistance at $128.16 and support at $126.81.
15-Minute Execution Context
The 15-minute chart shows compressed volatility with tight Bollinger Bands. An imminent directional breakout appears likely. The short-term pullback may also be losing downside force.
On this timeframe, price trades below both the 20-EMA at $128.04 and the 50-EMA at $129.42. However, it remains above the 200-EMA at $122.42. The RSI at 43.77 leans toward the softer side of neutral. At the same time, the MACD histogram has ticked slightly positive at 0.23. The MACD line at -1.16 stays below its signal at -1.38. That subtle detail suggests the pullback may be exhausting itself.
Bollinger bands are notably tight, with the upper band at $128.01 and the lower band at $126.39. The ATR14 here is just 0.91, indicating compressed volatility that often precedes a directional break. For anyone tracking Strategy stock, this compression around the $127.28 pivot is worth watching closely.
Strategy Stock Bullish Scenario: Bitcoin Flows Keep Fueling the Rally
The bullish case hinges on continued Bitcoin accumulation and crypto strength. MSTR shares recently hit a two-month high alongside Bitcoin trading back above $80,000. The company’s $370 million Bitcoin purchase last week reaffirms its aggressive treasury strategy.
If Bitcoin sustains its gains, MSTR could extend its push toward the daily resistance zone near $128.37 and beyond. Macro tailwinds such as expanded Treasury bond-buyback plans have pressured yields and weakened the dollar. This backdrop supports the crypto-linked rally. Eventually, Strategy stock could test the upper Bollinger band around $136.72. A daily close above $128.37, combined with the hourly MACD flipping positive, would confirm renewed strength.
What Would Invalidate the Bullish Setup
The bearish risk stems primarily from the hourly divergence and the persistent distance from the 200-day EMA at $157.67. A failure to hold the daily pivot at $127.08 could open the door to a retest of lower levels. A break below the 15-minute support near $126.39 would reinforce the bearish case.
Should Bitcoin momentum fade, MSTR’s leveraged exposure could amplify any downside move. Brokers’ average recommendation currently favors buying MSTR. However, that optimism has also been described as potentially overly optimistic. This caution is worth weighing against the technical conflict between daily and hourly momentum readings.
Overall, Strategy stock sits at a technical crossroads. The daily chart supports a bullish tilt. It is backed by trending EMAs, a firm MACD reading, and an RSI in bullish territory. Meanwhile, the hourly chart’s negative MACD crossover and soft RSI complicate that view. The tight 15-minute Bollinger range signals a volatility squeeze that could resolve in either direction. Given the ATR readings across all three timeframes, positioning should account for outsized moves. MSTR’s tight linkage to Bitcoin swings reinforces this caution around the pivot zone near $127. The wide distance to the 200-day EMA at $157.67 remains a reminder. This looks like a recovery attempt rather than a confirmed new uptrend.
What is driving Strategy stock’s recent recovery?
Strategy stock’s recovery is being driven by the company’s continued Bitcoin accumulation, including a $370 million purchase last week. MSTR shares recently hit a two-month high alongside Bitcoin trading back above $80,000. This reinforces the direct link between the equity price and crypto market sentiment.
Is Strategy stock’s daily trend bullish or bearish?
The daily chart supports a bullish bias, with price above both the 20-day EMA at $112.92 and the 50-day EMA at $110.77. The daily RSI at 63.25 confirms buyers are in control. However, the stock remains far below its 200-day EMA at $157.67. The broader trend has not yet turned bullish.
What is the key risk to Strategy stock’s rally?
The key risk is the conflicting signal between the daily and hourly charts. The hourly MACD has turned negative, suggesting the rally is losing near-term momentum. A failure to hold the daily pivot at $127.08 could open the door to a retest of lower levels. This risk grows if Bitcoin momentum fades.
What are the key levels to watch for Strategy stock?
Key levels include the daily pivot at $127.08, resistance at $128.37, and support at $126.40. On the upside, a close above $128.37 would confirm renewed strength toward the upper Bollinger band around $136.72. On the downside, a break below $126.39 on the 15-minute chart could trigger a deeper pullback.
Disclaimer: This article is for informational purposes only and does not constitute financial advice, an investment recommendation, or a solicitation to buy or sell any financial instrument or cryptocurrency. The analysis provided is not indicative of future results. Investing in crypto assets and financial markets carries a high risk of capital loss. Always do your own research (DYOR) and consult a qualified financial advisor before making any decision.
Article produced with the assistance of artificial intelligence and reviewed by the editorial team.
Source: cryptonews.net
2 Comments
Pingback: BMNR Stock Climbs As Ethereum Treasury Bet Scales Up – xpertsstudio
Pingback: Why is Bitcoin stable as Gold falls? – xpertsstudio