

Don't want to trade it yourself?
Our desk runs DEX portfolios on profit share.
Trading at $101.02 on the daily close, the Solana price today reflects a market caught between constructive structure and cooling momentum. After breaking above $100 late last month, $SOL now faces the harder question: can it hold without a serious pullback first?
Key takeaways
- $SOL closed at $101.02 on September 3, 2026, holding just above the psychological $100 threshold it broke through in late August.
- The daily MACD histogram turned slightly negative at -0.13, hinting at cooling momentum despite a still-healthy RSI reading of 64.24.
- Solana DEX activity continues to grow, with PumpSwap fees up 39.68% over 30 days and Orca DEX posting a 70.75% increase in the same period.
- The Fear & Greed Index sits at 65 in “Greed” territory, while the total crypto market cap slipped 2.15% to $2.64 trillion over the past 24 hours, according to CoinGecko.
- Daily ATR of 6.61 signals elevated volatility, meaning price swings of that magnitude in either direction would not be unusual.
The Daily Chart: A Recovery Not Yet Confirmed
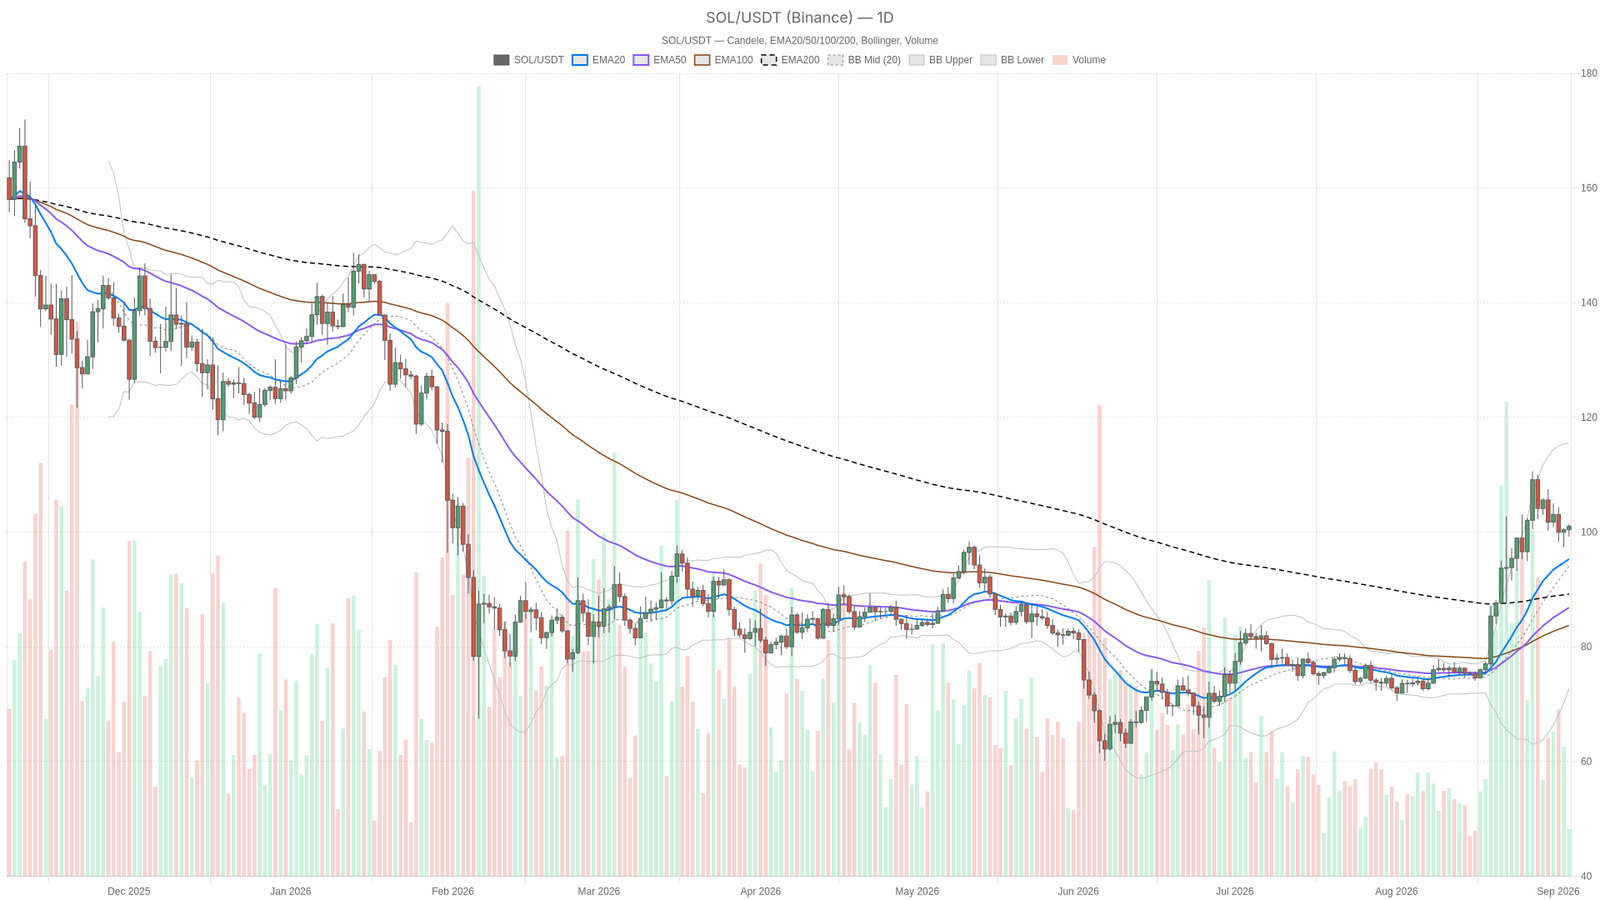
The daily chart shows $SOL in a recovery not yet fully confirmed — price structure remains constructive, but momentum readings are beginning to diverge. Fortune reported on August 27 that Solana was outperforming even Bitcoin, soaring above $100 on its own momentum. Now the EMA layout reveals an unusual configuration: the 20-period EMA at $95.31 sits well above both the 50-period EMA at $86.85 and the 200-period EMA at $89.20. Normally a clean bullish stack would show EMA20 above EMA50 above EMA200, but here the 50 is the lowest of the three.
That structure tells you the medium-term average is still catching up from an earlier slump while the short-term average has raced ahead thanks to the recent rally. It signals strong short-term buying pressure pushing into a trend that has not fully turned over on a medium-term basis — encouraging, but not yet confirmed. Meanwhile, RSI on the daily sits at 64.24, comfortably bullish without being stretched into overbought territory, leaving room before this trade becomes crowded.
However, the MACD tells a slightly different story. The MACD line at 6.39 sits just under the signal line at 6.52, with a histogram reading of -0.13. That small negative print hints that the daily uptrend is losing a bit of thrust even while RSI still looks healthy. This is the kind of internal disagreement worth flagging: price and RSI say “still bullish,” while MACD says “momentum is cooling.” Neither is wrong; they measure different things, and together they suggest a market catching its breath rather than one clearly out of gas.
Bollinger Bands place the mid-line at $94.09, with the upper band at $115.46 and the lower band at $72.72. Price at $101.02 sits comfortably in the upper half, leaving room to move in either direction. The daily ATR of 6.61 reminds us this is not a low-volatility asset. The daily pivot at $100.55, with resistance at $101.86 and support at $99.70, frames the immediate battle. Price sits right on top of the pivot, and the next directional push likely gets decided within that tight band. Notably, the system’s regime read remains neutral — a fair label for a chart that rallied hard and is now digesting the move.
Hourly and 15-Minute Charts: Where the Tension Shows
The hourly chart reveals building short-term strength even as the daily timeframe shows early signs of fatigue, creating genuine tension between the two timeframes. Price at $101.06 is trading above both its 20-EMA at $100.21 and 50-EMA at $100.56, but sits just below the 200-EMA at $101.16. That gives a short-term bullish tilt capped by a longer intraday ceiling — buyers control recent hours but have not cleared the bigger hourly obstacle yet.
RSI at 58.18 backs up the modestly bullish read without suggesting anything overheated. Moreover, the MACD histogram at 0.22 (line 0.27, signal 0.04) is actually expanding to the upside — momentum building on the hourly chart even as it fades on the daily. This is the real tension in the current setup: the smaller timeframe gains strength right as the bigger one shows early fatigue. It more likely means the current move is a short-term bounce inside a larger daily consolidation, rather than confirmation of a forceful uptrend resumption.
Zooming into the 15-minute chart, useful only for execution rather than calling direction, the EMA stack shows 20 ($100.68) above 200 ($100.37) above 50 ($100.27). However, RSI at 56.86 and a nearly flat MACD histogram of 0.02 point to indecision at the micro level. Price hugs the upper Bollinger Band at $101.39 inside a tight range between pivot support at $100.79 and resistance at $101.22. In practice, intraday traders lack a strong edge in either direction; the bigger decisions are being made on the daily and hourly charts.
What’s Happening Underneath the Chart
On-chain DEX activity on Solana has been growing meaningfully, supporting the idea that real usage underpins the recent price move. Bitcoin dominance sits at 59.1%, meaning capital has not rotated into altcoins broadly — $SOL’s strength has been idiosyncratic rather than part of a market-wide risk-on wave. Meanwhile, the Fear & Greed Index reads 65 in “Greed” territory, even as the total crypto market cap pulled back 2.15% to $2.64 trillion, according to CoinGecko. That combination is worth noting: traders remain greedy despite a broader risk-off wobble. Yet elevated greed readings during cooling momentum are also when sharp unwinds tend to happen if a catalyst turns negative.
On the fundamentals side, PumpSwap’s fees are up 23.42% in 24 hours, 33.46% over 7 days, and 39.68% over 30 days. Orca DEX posted a 30-day fee increase of 70.75%, and Raydium AMM is up 44.25% over the same period. Both saw daily and weekly pullbacks — a sign of choppy but net-positive usage growth. However, not everything thrives equally: HumidiFi’s fees collapsed by 100% over 30 days, a reminder that liquidity within Solana’s DEX ecosystem moves unevenly. Still, the broader pattern of rising fees on major venues supports the case that real usage has been building underneath the price action.
Bullish Scenario
For the bullish case to gain traction, $SOL would need to clear daily pivot resistance at $101.86 and hold above it, with the hourly MACD histogram continuing to expand rather than fade. That would suggest the short-term bounce is feeding back into the daily trend rather than staying an isolated hourly move. A daily RSI push through the mid-60s without MACD histogram deterioration would be the cleanest signal that buyers are back in charge, opening a path toward the upper Bollinger Band near $115.46. Growing DEX fee activity on Solana would add fundamental weight to that move.
This scenario gets invalidated if the daily MACD histogram keeps sliding negative even as price tries to push higher — that kind of divergence usually precedes a fade rather than a breakout.
Bearish Scenario
The bearish case leans on the daily MACD histogram already sitting in negative territory at -0.13 and the fact that the 50-day EMA remains notably below both the 20 and 200-day EMAs — a structure that has not fully repaired itself. A break below daily support at $99.70, paired with an hourly close slipping under the 50-EMA at $100.56, would open the door to a deeper mean-reversion move. That path leads back toward the daily 20-EMA near $95.31, and potentially further toward the $86.85–$89.20 zone where the 50 and 200-day EMAs currently sit.
A continued 2%+ drawdown in total crypto market cap alongside rising Bitcoin dominance would add macro pressure, since altcoins tend to underperform when capital concentrates back into BTC. That said, this bearish setup gets invalidated if price reclaims $101.86 with the daily MACD histogram turning positive — that would flip the momentum narrative toward continuation rather than correction.
Positioning and Risk
Right now, the honest read on Solana is that it is caught between a daily chart cooling off and an hourly chart trying to build fresh momentum — two timeframes not fully agreeing. With daily ATR at 6.61, small moves rarely stay small for long, and the Greed reading of 65 means sentiment could amplify either direction. The Solana price today sits at a genuine decision point. Traders should treat the pivot cluster between $99.70 and $101.86 as the range requiring a decisive break before either scenario gets real conviction. Until then, this looks more like a market choosing its next move than one that has already made it.
What is $SOL trading at right now?
As of September 3, 2026, $SOL closed at $101.02 on the daily timeframe, holding just above the psychological $100 threshold it broke through in late August.
What are the key support and resistance levels for Solana?
The daily pivot sits at $100.55, with immediate resistance at $101.86 and support at $99.70. A break above resistance opens a path toward the upper Bollinger Band near $115.46, while a drop below support could lead to a mean-reversion move toward the 20-EMA at $95.31.
Is Solana’s on-chain activity supporting the price rally?
Yes, DEX activity on Solana has been growing. PumpSwap fees rose 39.68% over 30 days, Orca DEX posted a 70.75% increase, and Raydium AMM is up 44.25% in the same period, suggesting real usage underpins the recent price move rather than purely speculative flow.
What is the market sentiment around Solana right now?
The Fear & Greed Index sits at 65 in “Greed” territory, even as the broader crypto market pulled back 2.15%. This suggests traders remain inclined to buy dips, though elevated greed during cooling momentum can also precede sharp unwinds if sentiment turns negative.
Disclaimer: This article is for informational purposes only and does not constitute financial advice, an investment recommendation, or a solicitation to buy or sell any financial instrument or cryptocurrency. The analysis provided is not indicative of future results. Investing in crypto assets and financial markets carries a high risk of capital loss. Always do your own research (DYOR) and consult a qualified financial advisor before making any decision.
Article produced with the assistance of artificial intelligence and reviewed by the editorial team.
Source: cryptonews.net