

Don't want to trade it yourself?
Our desk runs DEX portfolios on profit share.
Solana price today: RSI hits extreme 84 as rally tests $105 resistance
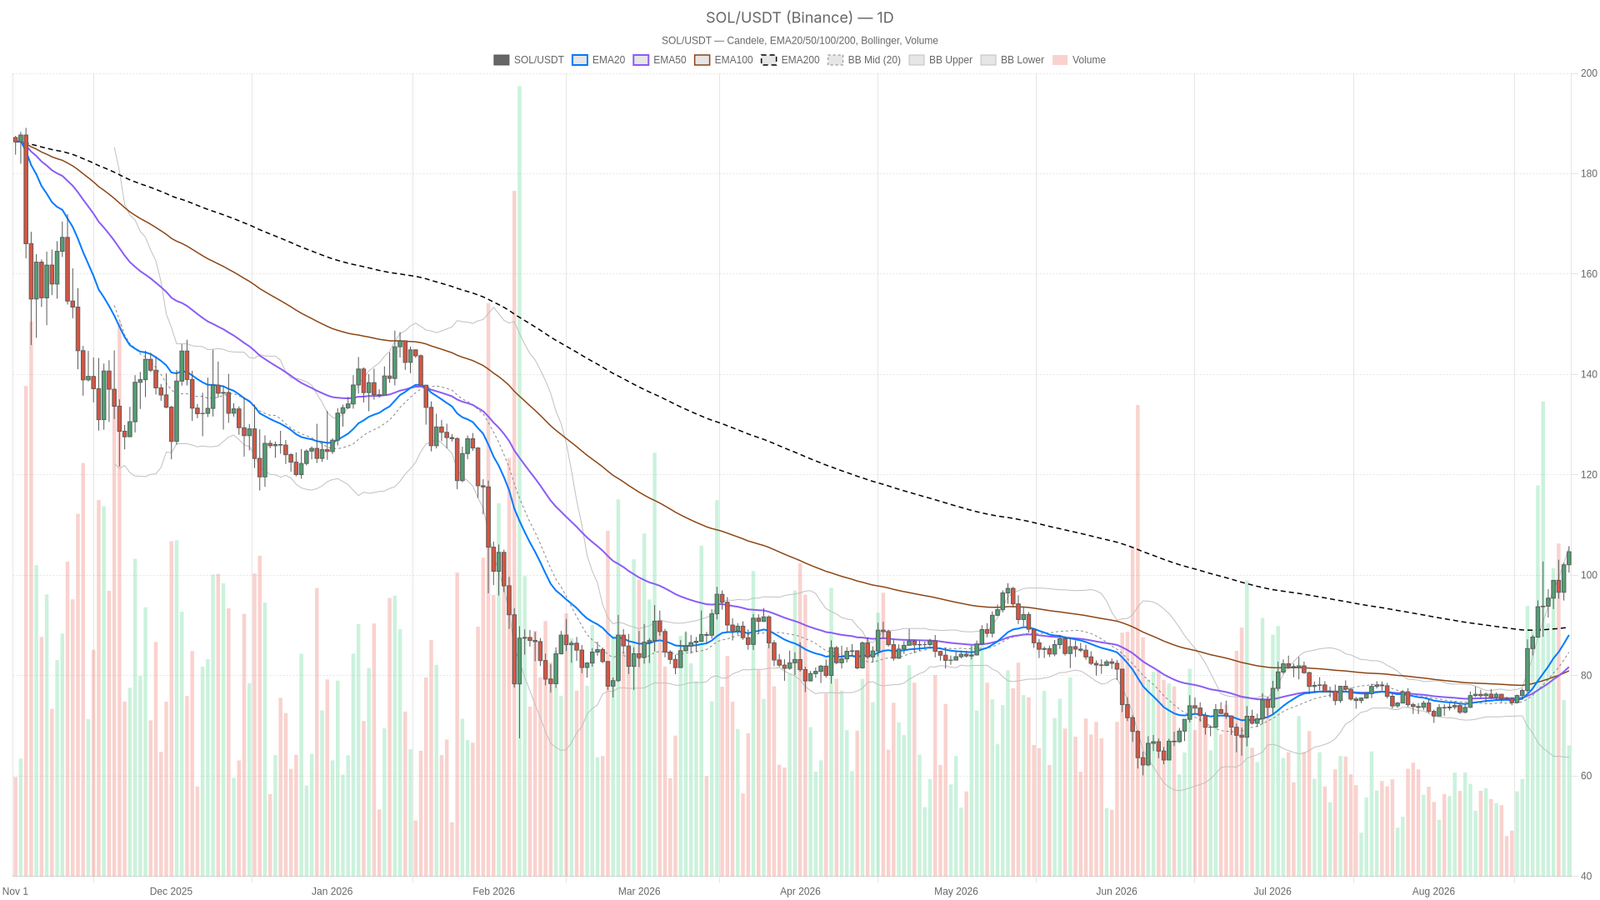
As of August 27, 2026, Solana price today sits at $104.67 on the daily chart. It holds just below the $105.59 upper Bollinger Band and its daily pivot resistance at $106.80. Weeks of grinding higher have pushed the trend toward a genuine decision point.
Key takeaways
- Solana trades at $104.67 on August 27, 2026, below the $105.59 upper Bollinger Band.
- The daily RSI14 reads 84.01, a stretched overbought level despite bullish moving averages.
- Price holds above the EMA20 ($88.10), EMA50 ($81.73), and EMA200 ($89.65).
- The Fear & Greed Index sits at 71, while Bitcoin dominance is 59.19%.
- The $105–$107 zone is the key decision area for the next move.
Daily Trend Still Bullish, But Stretched
The daily trend is bullish, but the momentum reading is stretched. On the daily timeframe, $SOL trades at $104.67, comfortably above its EMA20 ($88.10), EMA50 ($81.73), and EMA200 ($89.65). Price holds above all three moving averages, showing buyers have controlled the tape for a while, not just in a single spike.
The problem is the daily RSI14 at 84.01. That is an extreme reading, well into territory where pullbacks or sideways digestion tend to show up historically. When RSI runs this hot for this long, it does not automatically mean a reversal is imminent. However, it does mean the move has burned through much of its short-term fuel.
The MACD backs the bullish case for now: the line at 6.88 is above the signal at 4.47, with a histogram of 2.41. Momentum is still expanding rather than rolling over. Yet an expanding MACD paired with an 84 RSI is the kind of setup where one sharp red candle can flip the picture fast.
The daily Bollinger Bands frame this well: mid-band at $84.66, upper band at $105.59, lower band at $63.73. Price is riding the upper band. In a strong trend, that can mean walking the band higher. Yet it also means very little room remains. The market must either break out convincingly or get rejected toward the mid-band.
Daily ATR14 of $5.50 confirms volatility has picked up. Moves of that size in either direction are now the norm, not the exception. The system still tags this daily regime as neutral rather than outright bullish. This lines up with the overbought warning under an otherwise constructive structure.
1H Timeframe: Momentum Confirms, But It Is Cooling
The one-hour chart is officially bullish, but momentum is cooling. Price at $104.60 sits above the EMA20 ($100.97), EMA50 ($99.11), and EMA200 ($93.08), a clean bullish stack. RSI14 at 72.64 is still elevated yet noticeably less extreme than the daily reading. That suggests the shorter-term move has room to breathe, even if the bigger trend is gasping for air. MACD on the 1H is positive (line 1.72 vs signal 1.25, histogram 0.47), keeping the bullish bias intact for now.
Moreover, the 1H pivot levels are remarkably tight: pivot at $104.63, R1 at $105.00, S1 at $104.24. That narrow band means the market is coiling right under resistance rather than pushing through it with conviction. The 1H Bollinger Band upper limit of $105.77 lines up almost exactly with the daily resistance zone. This adds weight to the $105–$106 area as the real line in the sand.
15-Minute View: Execution Context Only
The 15-minute chart is bullish in structure, but momentum is fading at this resolution. $SOL trades at $104.48, still above its EMA20 ($103.33), EMA50 ($101.70), and EMA200 ($98.96). However, RSI14 has cooled to 67.22, and the MACD histogram has shrunk to just 0.12, down from the more robust readings on higher timeframes. That is a classic sign of a trend losing steam into resistance rather than accelerating through it.
The 15m pivot sits at $104.55, with R1 barely above at $104.62, essentially no room. This tells intraday traders it is a decision zone, not a continuation zone. This lower timeframe should only be used to time entries or exits around the higher-timeframe levels, not to define bias.
The Bigger Picture: Sentiment and On-Chain Activity
Sentiment is greedy while capital stays concentrated in Bitcoin, creating a mixed backdrop for altcoins. The Fear & Greed Index reads 71, classified as “Greed,” consistent with the overbought technical picture $SOL is showing. At the same time, total crypto market cap is essentially flat to slightly down over 24 hours (-0.47%). Bitcoin dominance stands at 59.19% according to the aggregated market data.
That combination, greedy sentiment but capital concentrated in BTC, can be a headwind for altcoins like $SOL trying to extend gains. It suggests rotation into majors rather than broad risk-on flow into the alt space. On the Solana ecosystem side, DEX fee data tells a more encouraging story about network usage. Orca DEX and Raydium AMM both show strong 30-day fee growth of 106.72% and 47.91% respectively. Daily fees pulled back on both platforms (-27.18% and -19.79% day-over-day).
PumpSwap posted a sharp +34.73% daily fee jump despite a softer 30-day trend. BisonFi’s 30-day fees are up a striking 215.23% even after a rough recent week. This push-and-pull across Solana’s DEX landscape suggests genuine on-chain rotation and activity rather than a dead ecosystem. That fundamental backdrop supports the idea that demand for Solana price today is not purely speculative positioning.
Bullish and Bearish Scenarios
The bullish case depends on a confirmed break above the $105.59–$106.80 zone. $SOL must clear and hold above that area, defined by the daily Bollinger upper band and the R1 pivot. A confirmed break, especially with the daily MACD histogram expanding rather than contracting, would open the door to further upside. The still-intact bullish EMA stack backs this scenario. It would be invalidated if price fails to hold above the 1H EMA20 near $100.97. A slip under the daily S1 at $101.53 would also signal the breakout attempt failed.
On the other hand, the bearish, or more accurately mean-reversion, case leans on that daily RSI of 84.01. Extreme overbought readings this stretched often resolve with at least a pullback toward the daily EMA20 ($88.10) or the Bollinger mid-band ($84.66). This can happen even within an intact broader uptrend.
This scenario gains weight if the 15m and 1H MACD histograms keep shrinking the way they already are, showing momentum divergence into resistance. A strong daily close back above $105.59 on rising volume would invalidate it, suggesting the overbought condition is being absorbed rather than corrected.
Where This Leaves Traders
Traders face a market caught between bullish structure and stretched momentum. Right now Solana is at a genuine inflection point rather than in a clean continuation. The daily, 1H, and 15m timeframes all agree on direction, but they disagree on conviction. Momentum is clearly fading the closer you look at shorter intervals, even as the bigger trend holds.
That said, none of this points to an imminent crash. It does point to the $105–$107 zone as a real decision point rather than just another number on the chart. Volatility, as measured by ATR across all three timeframes, has picked up. Whatever happens next is likely to happen with some speed.
Given the elevated RSI on daily, the tight pivot compression on 1H, and the fading histogram on 15m, this moment calls for patience over conviction. Nothing here should be read as a signal to chase the move in either direction. The next few sessions should clarify whether the trend has more to give or needs to cool off first.
Where does Solana trade on August 27, 2026?
Solana trades at $104.67 on the daily chart, below the $105.59 upper Bollinger Band and the $106.80 daily pivot resistance.
Is Solana overbought right now?
Yes. The daily RSI14 reads 84.01, an extreme overbought level, while the 1H RSI14 is lower at 72.64.
What is the key resistance level to watch?
The $105.59–$106.80 zone is the main decision area, where the daily Bollinger upper band and the R1 pivot converge.
Disclaimer: This article is for informational purposes only and does not constitute financial advice, an investment recommendation, or a solicitation to buy or sell any financial instrument or cryptocurrency. The analysis provided is not indicative of future results. Investing in crypto assets and financial markets carries a high risk of capital loss. Always do your own research (DYOR) and consult a qualified financial advisor before making any decision.
Article produced with the assistance of artificial intelligence and reviewed by the editorial team.
Source: cryptonews.net
2 Comments
Pingback: BlackRock’s Exec Says CLARITY Act Is ‘Less Critical’ for Bitcoin Other Cryptos – xpertsstudio
Pingback: A Democrat Midterm Win Wouldn’t Derail Bitcoin, VanEck’s Matthew Sigel Says – xpertsstudio