

Don't want to trade it yourself?
Our desk runs DEX portfolios on profit share.
Ripple <a href="https://xpertsstudio.com/xrp-price-prediction-spot-volume-hits-6/” title=”XRP Price Prediction: Spot Volume Hits 6″>Price Analysis: Where Is XRP Heading Next Week After Defending Its 200-Day EMA?
Ripple’s XRP remains in a corrective phase after its sharp August breakout, with buyers struggling to regain control of the key overhead supply zone. The current structure suggests that the market may need more consolidation before another sustained directional move develops.
XRP Price Analysis: The Daily Chart
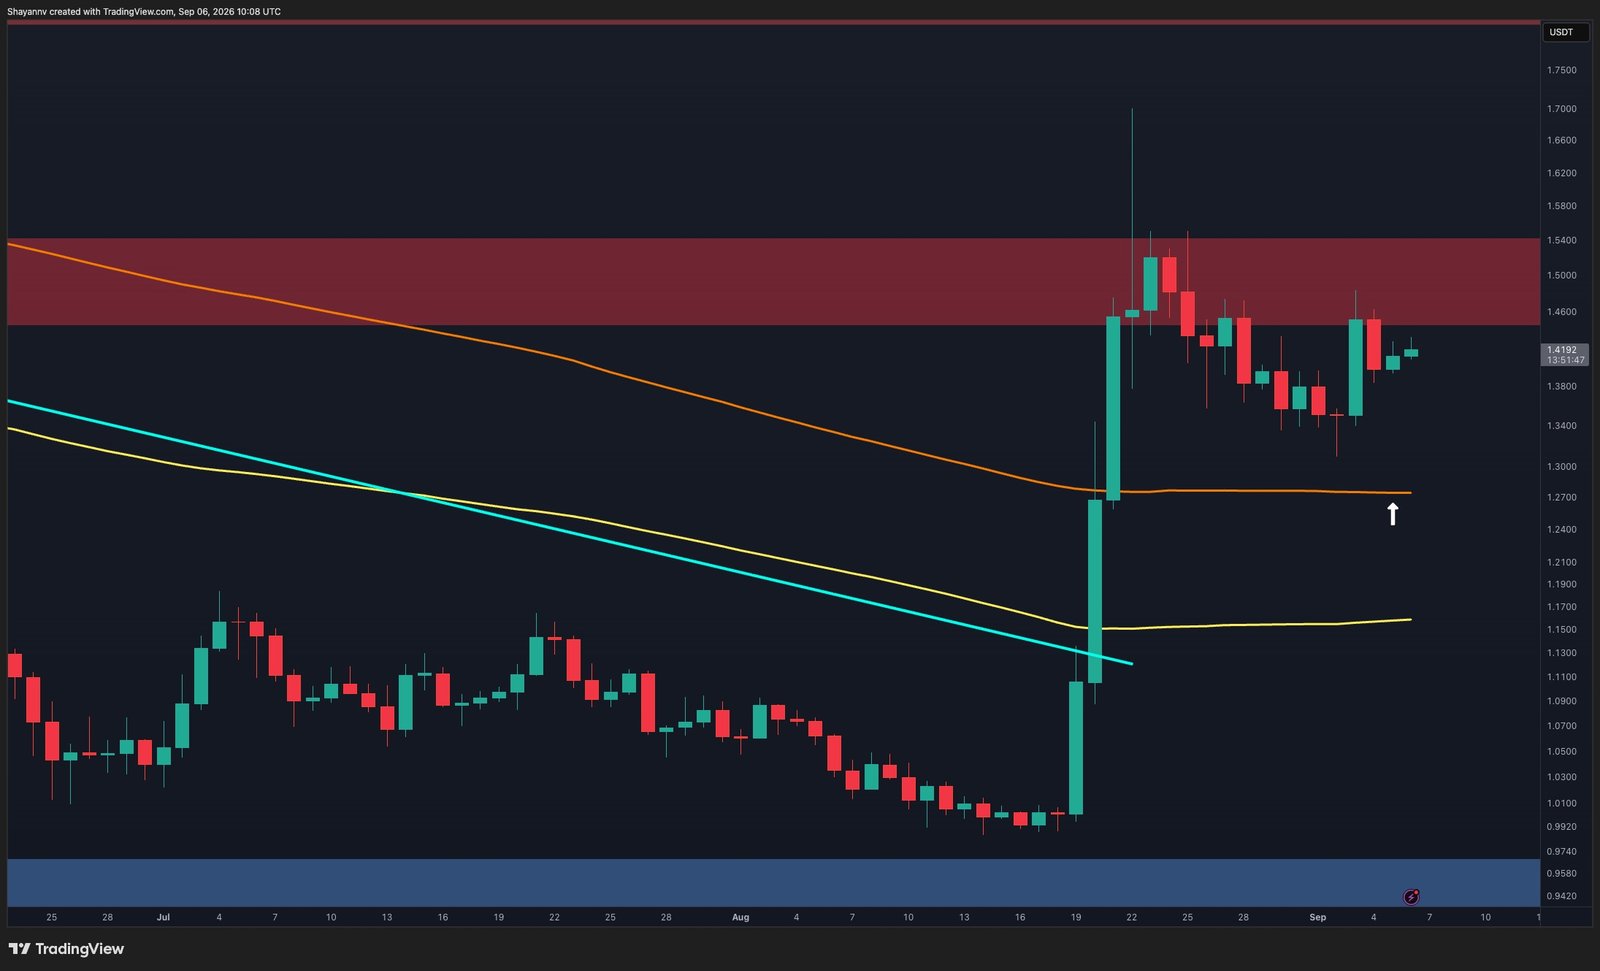
On the daily timeframe, XRP’s explosive rally from the $0.94-$0.97 support zone broke the previous descending structure and pushed the price as high as roughly $1.70. However, the breakout was followed by an equally notable rejection, and the asset has since been unable to establish itself above the $1.45-$1.54 resistance zone.
The price is currently trading around $1.42, just below this major supply area. More importantly, XRP continues to hold above the long-term moving average near $1.27, which has flattened after previously trending lower. This level represents an important structural support for the ongoing recovery.
As long as the $1.27 area holds, the recent weakness can still be viewed as consolidation following an impulsive rally. A daily close above the $1.45-$1.54 resistance zone would strengthen the bullish case and could eventually bring the $1.70 high back into focus. Conversely, losing the $1.27 support would substantially weaken the structure and increase the probability of a deeper retracement toward the lower moving average around $1.15.
XRP/USDT 4-Hour Chart
The 4-hour chart highlights a descending channel that has contained XRP since the initial surge. The asset has repeatedly failed to break through the channel’s upper boundary, which is now converging with the crucial $1.45-$1.54 resistance zone.
The latest rebound from around $1.34 has brought XRP back toward $1.42, placing it directly beneath this descending resistance. This makes the current area particularly important. A breakout above the trendline followed by a successful reclaim of $1.45 could signal that the corrective structure is ending, with the $1.50-$1.54 zone becoming the next hurdle.
However, another rejection would preserve the descending structure and could send the token back toward $1.34-$1.38. Below there, the channel’s lower boundary is approaching the $1.27-$1.30 region, which overlaps with a clearly defined support zone.
Therefore, XRP remains caught between improving support underneath and persistent resistance overhead. Until the descending channel is broken, the short-term outlook appears more consistent with continued consolidation and potentially another corrective move rather than an immediate bullish continuation.
Disclaimer: Information found on CryptoPotato is those of writers quoted. It does not represent the opinions of CryptoPotato on whether to buy, sell, or hold any investments. You are advised to conduct your own research before making any investment decisions. Use provided information at your own risk. See Disclaimer for more information.
About the author
Full-time on-chain Data Analyst and Python Programmer. Passionate about Bitcoin and DataVisualization.
Source: cryptopotato.com