


Don't want to trade it yourself?
Our desk runs DEX portfolios on profit share.
Uniswap (UNI) changes hands at 4.39 US dollars on 25 August 2026, about 59.8 percent below the twelve-month high of 10.93 dollars set on 25 August 2025 and roughly 83.4 percent above the twelve-month low of 2.40 dollars printed on 11 June 2026. A gain of 34.2 percent over seven days has carried the token above both of its main moving averages for the first time in months. The question here is narrower than that move suggests: is Uniswap a good buy at the current price?
cryptoticker.io collected the underlying price data itself on 25 August 2026.ices from 25 August 2025 to 24 August 2026 plus the current spot quote, with the exponential moving averages and the relative strength index derived from those closes using the standard formulas, the RSI after Wilder. A longer-dated view sits in our Uniswap price prediction
Uniswap price analysis: where the UNI price stands and which levels matter
Three levels frame the picture. The floor is the twelve-month low at 2.40 dollars, printed on 11 June 2026 and now 83.4 percent below the market. The current zone around 4.39 dollars sits about 18.8 percent above the 50-day exponential moving average of 3.70 dollars and about 10.6 percent above the 200-day exponential moving average of 3.98 dollars. Overhead there is no nearby marker at all: the next reference point of any weight is the twelve-month high of 10.93 dollars, some 149 percent away.
That gap upward is the unusual feature of the chart: between 4.39 dollars and 10.93 dollars the token spent most of the past year falling rather than consolidating, which leaves little price memory in between. The more immediate reference is the pair of averages. The price reclaimed the 200-day line at 3.98 dollars during the advance rather than merely touching it, and the 50-day line at 3.70 dollars now sits below the market as well. Both are beneath the spot price for the first time in this cycle, and both can serve as support rather than resistance.
Is the Uniswap downtrend broken or only interrupted?
One qualification belongs next to it. The 50-day average at 3.70 dollars still sits below the 200-day average at 3.98 dollars, the residue of the decline, and it takes weeks of higher prices to unwind. The price has completed the turn; the averages have not yet followed.
That gives a falsification test rather than an opinion. If UNI closes back below 3.98 dollars and holds there for more than a few sessions, the reclaim was a spike inside a continuing downtrend and the case made here is wrong. If the 50-day average instead rises through the 200-day while the price holds above both, the transition is complete.
What RSI and moving averages mean for a Uniswap entry
The 14-day relative strength index stands at 65.5, below the 70 conventionally treated as overbought but in the upper third of the range. An RSI in the mid-sixties after a 34.2 percent week describes a market that has already done most of its repricing in public.
The distance to the averages says the same in a different unit. A price 18.8 percent above its 50-day average of 3.70 dollars is stretched by any standard for this asset, and a return to that line from 4.39 dollars is a decline of roughly 16 percent that would leave the broken downtrend intact. The case for UNI improved materially when the price cleared 3.98 dollars; the case for buying at 4.39 dollars specifically is weaker, and the two are worth keeping apart.
What Uniswap trading volume reveals about demand
Volume is the check on whether a price move reflects real demand or a thin book. Over the past 24 hours UNI turned over about 292.6 million dollars against a twelve-month median of about 225.1 million, roughly 1.3 times normal. The seven-day average is more telling at about 339.8 million dollars, close to 1.5 times that median, against a 30-day average of about 242.0 million.
The rally was therefore accompanied by a sustained rise in turnover rather than a single spike, the pattern that distinguishes a repricing with participation from a drift on a thin book. Against a market capitalisation of about 2.74 billion dollars and rank 32, that liquidity is ample for retail-sized orders.
<img src="https://xpertsstudio.com/wp-content/uploads/2026/08/image-71.png" alt="Crypto exchange check: which venue comes out on top? Compare the terms” loading=”lazy”>
Crypto exchange check: which venue comes out on top? Compare the terms
Which structural factors speak for Uniswap
Three structural features distinguish UNI from the wider field of mid-cap tokens. The first is the protocol behind it. Uniswap is the reference implementation of the automated market maker, the design that made decentralised spot trading work at scale, and it has held a leading share of decentralised exchange volume through several market cycles. Whatever is uncertain about the token, the software is used continuously by parties who are not speculating on it.
The second is the multi-chain footprint. The protocol was built on Ethereum and has since been deployed across the major layer-two networks, where fees make small trades economic in a way they are not on the base layer. That binds its growth to the scaling programme documented in the Ethereum roadmap.
The third factor is the sharpest open question, and it concerns the token rather than the protocol. UNI is a governance token, conferring voting rights over the protocol’s parameters and treasury. Whether and how a share of the fees generated by trading activity should reach token holders has been a recurring subject of Uniswap governance rather than a settled feature, and a multi-year view on UNI is a view on how that resolves.
The regulatory frame is developing rather than fixed. In the European Union the markets in crypto-assets regulation governs how venues and issuers operate, and the supervisory position is set out by ESMA on its MiCA pages. A governance token of a decentralised protocol sits less settled under that framework than an asset listed and custodied by a regulated venue, which is a question about classification rather than an allegation about anyone.
What speaks for buying Uniswap at current prices
Three arguments carry weight at 4.39 dollars. The trend evidence is the strongest. The price stands above the 200-day average of 3.98 dollars and above the 50-day average of 3.70 dollars, and most assets that recover from a drawdown of this depth fail at the long average rather than clearing it.
The second argument is that the move is funded. At 339.8 million dollars of average daily turnover over seven days against a twelve-month median of 225.1 million, the advance has been accompanied by participation rather than by a vacuum.
The third is the starting point. At 59.8 percent below the twelve-month high of 10.93 dollars, UNI is priced well beneath its own recent range even after a 34.2 percent week. For an investor whose thesis rests on continued use of the protocol rather than on a near-term move, that discount is the substance of the case.
What speaks against buying Uniswap at current prices
Three arguments cut the other way, and the first two concern timing rather than the asset. Entry price is the immediate objection: a 34.2 percent gain over seven days, an RSI of 65.5 and a distance of 18.8 percent to the 50-day average of 3.70 dollars describe a market that has moved far in a short time, and a return to that line would cost about 16 percent without changing anything structural.
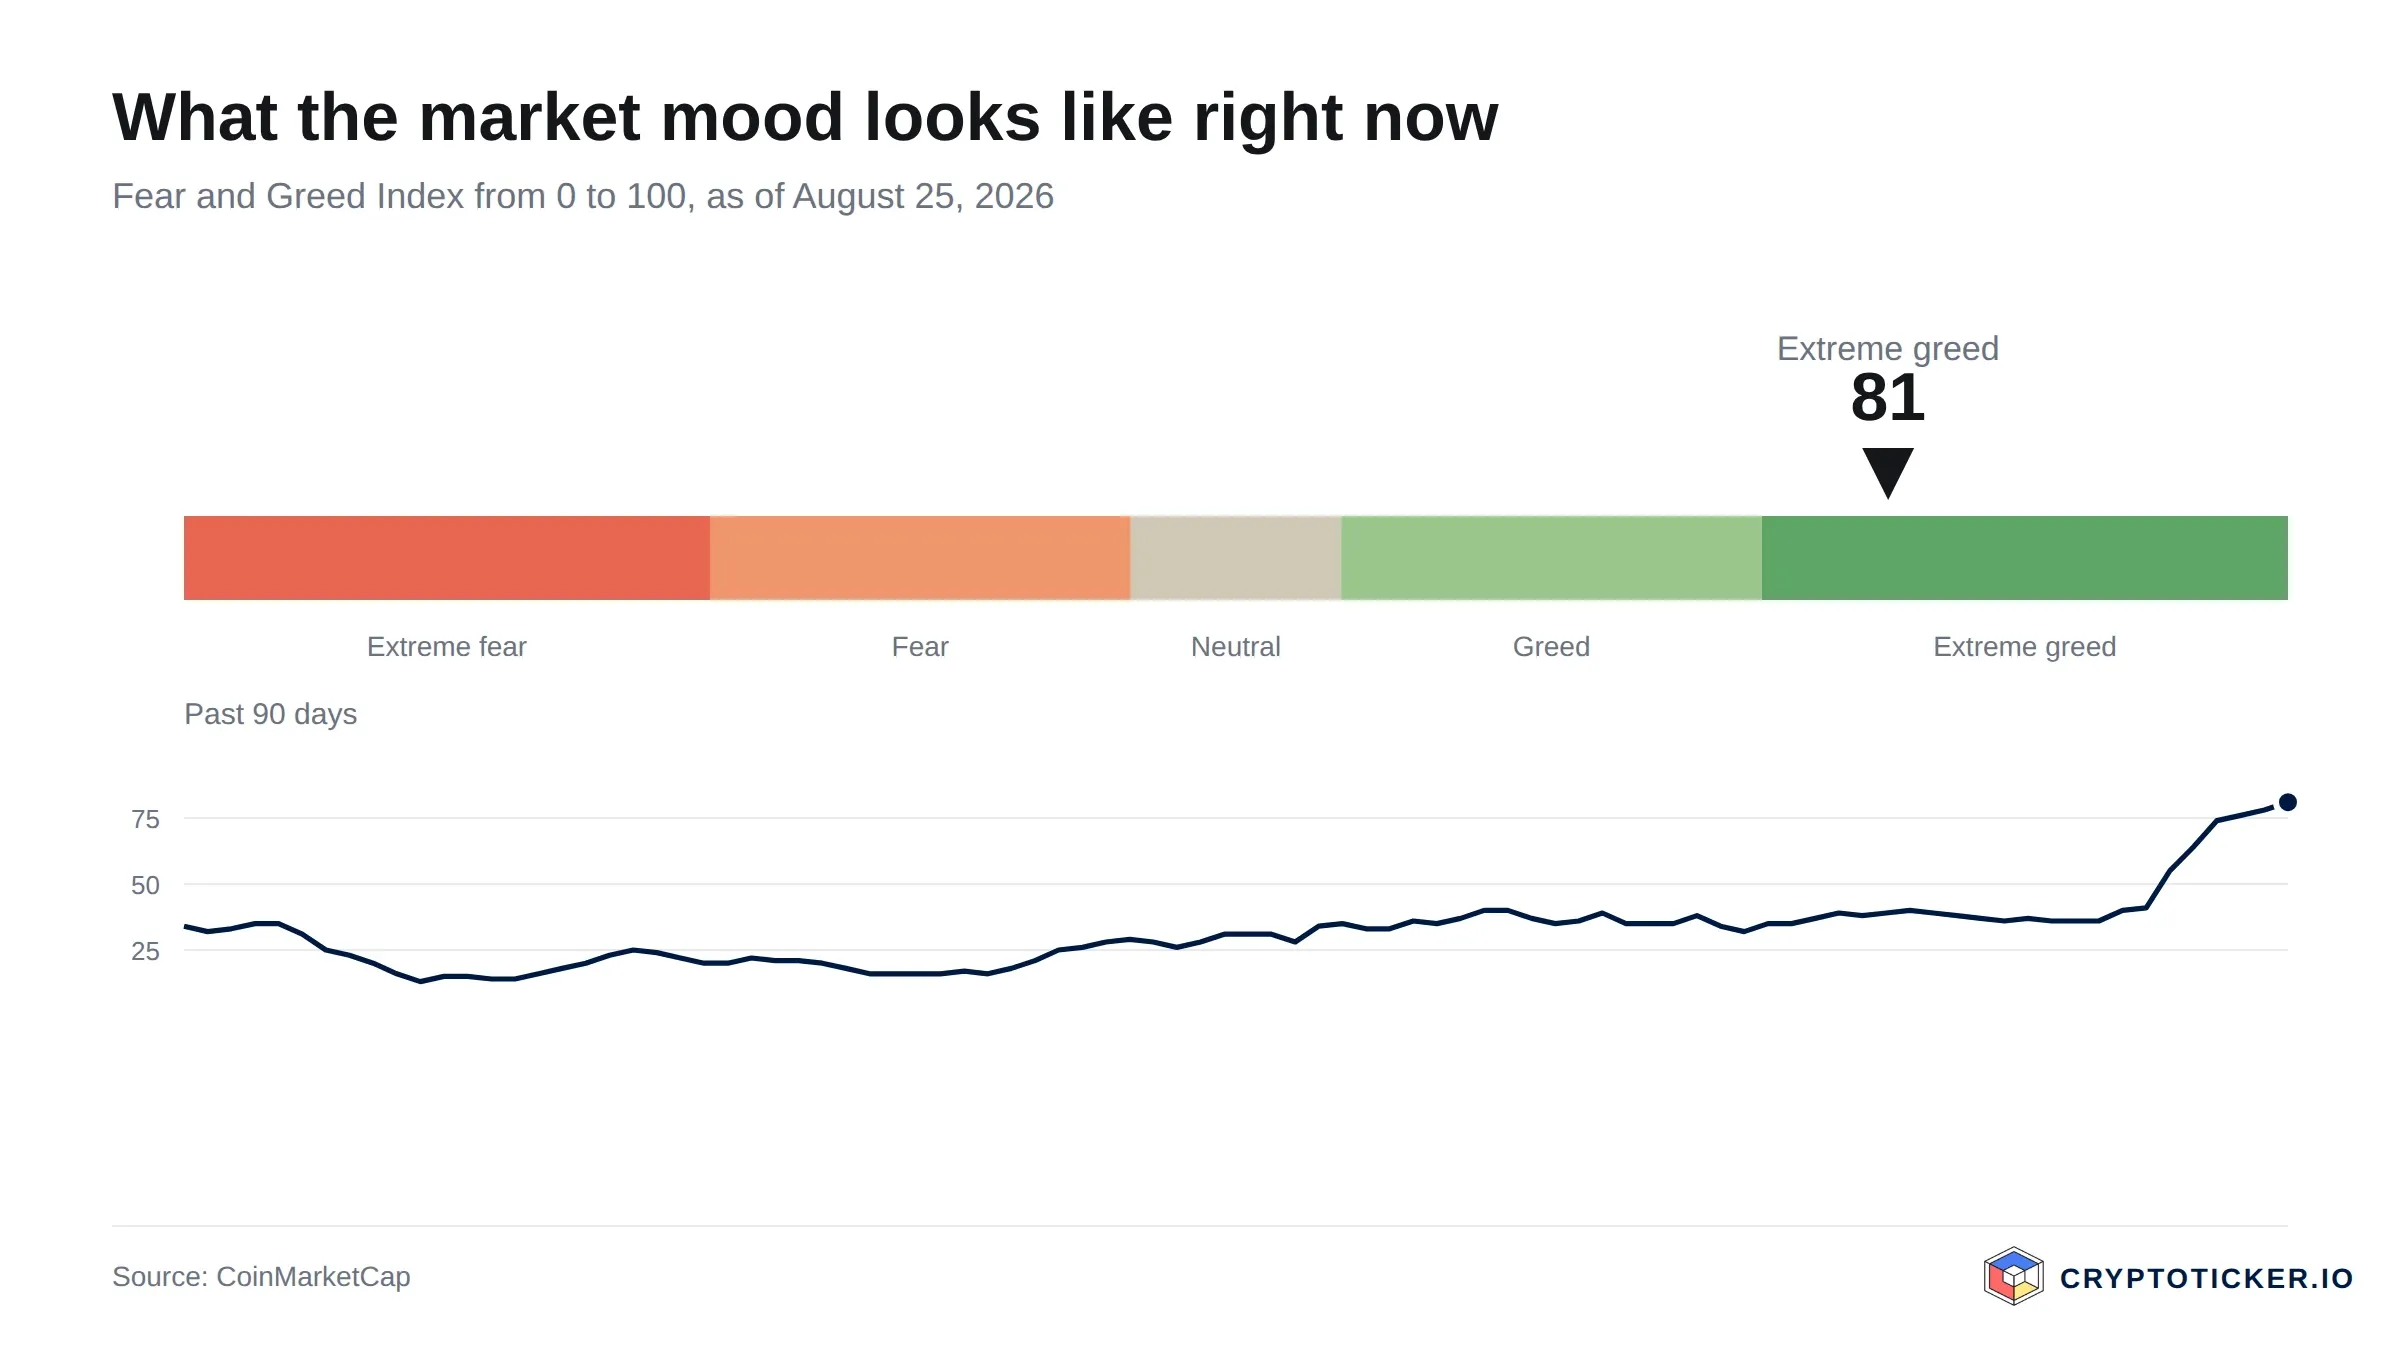
Market sentiment compounds that. The crypto fear and greed index stands at 81 out of 100, in the extreme greed band. The reading is not a forecast, but it describes the environment in which an entry at 4.39 dollars would be made.
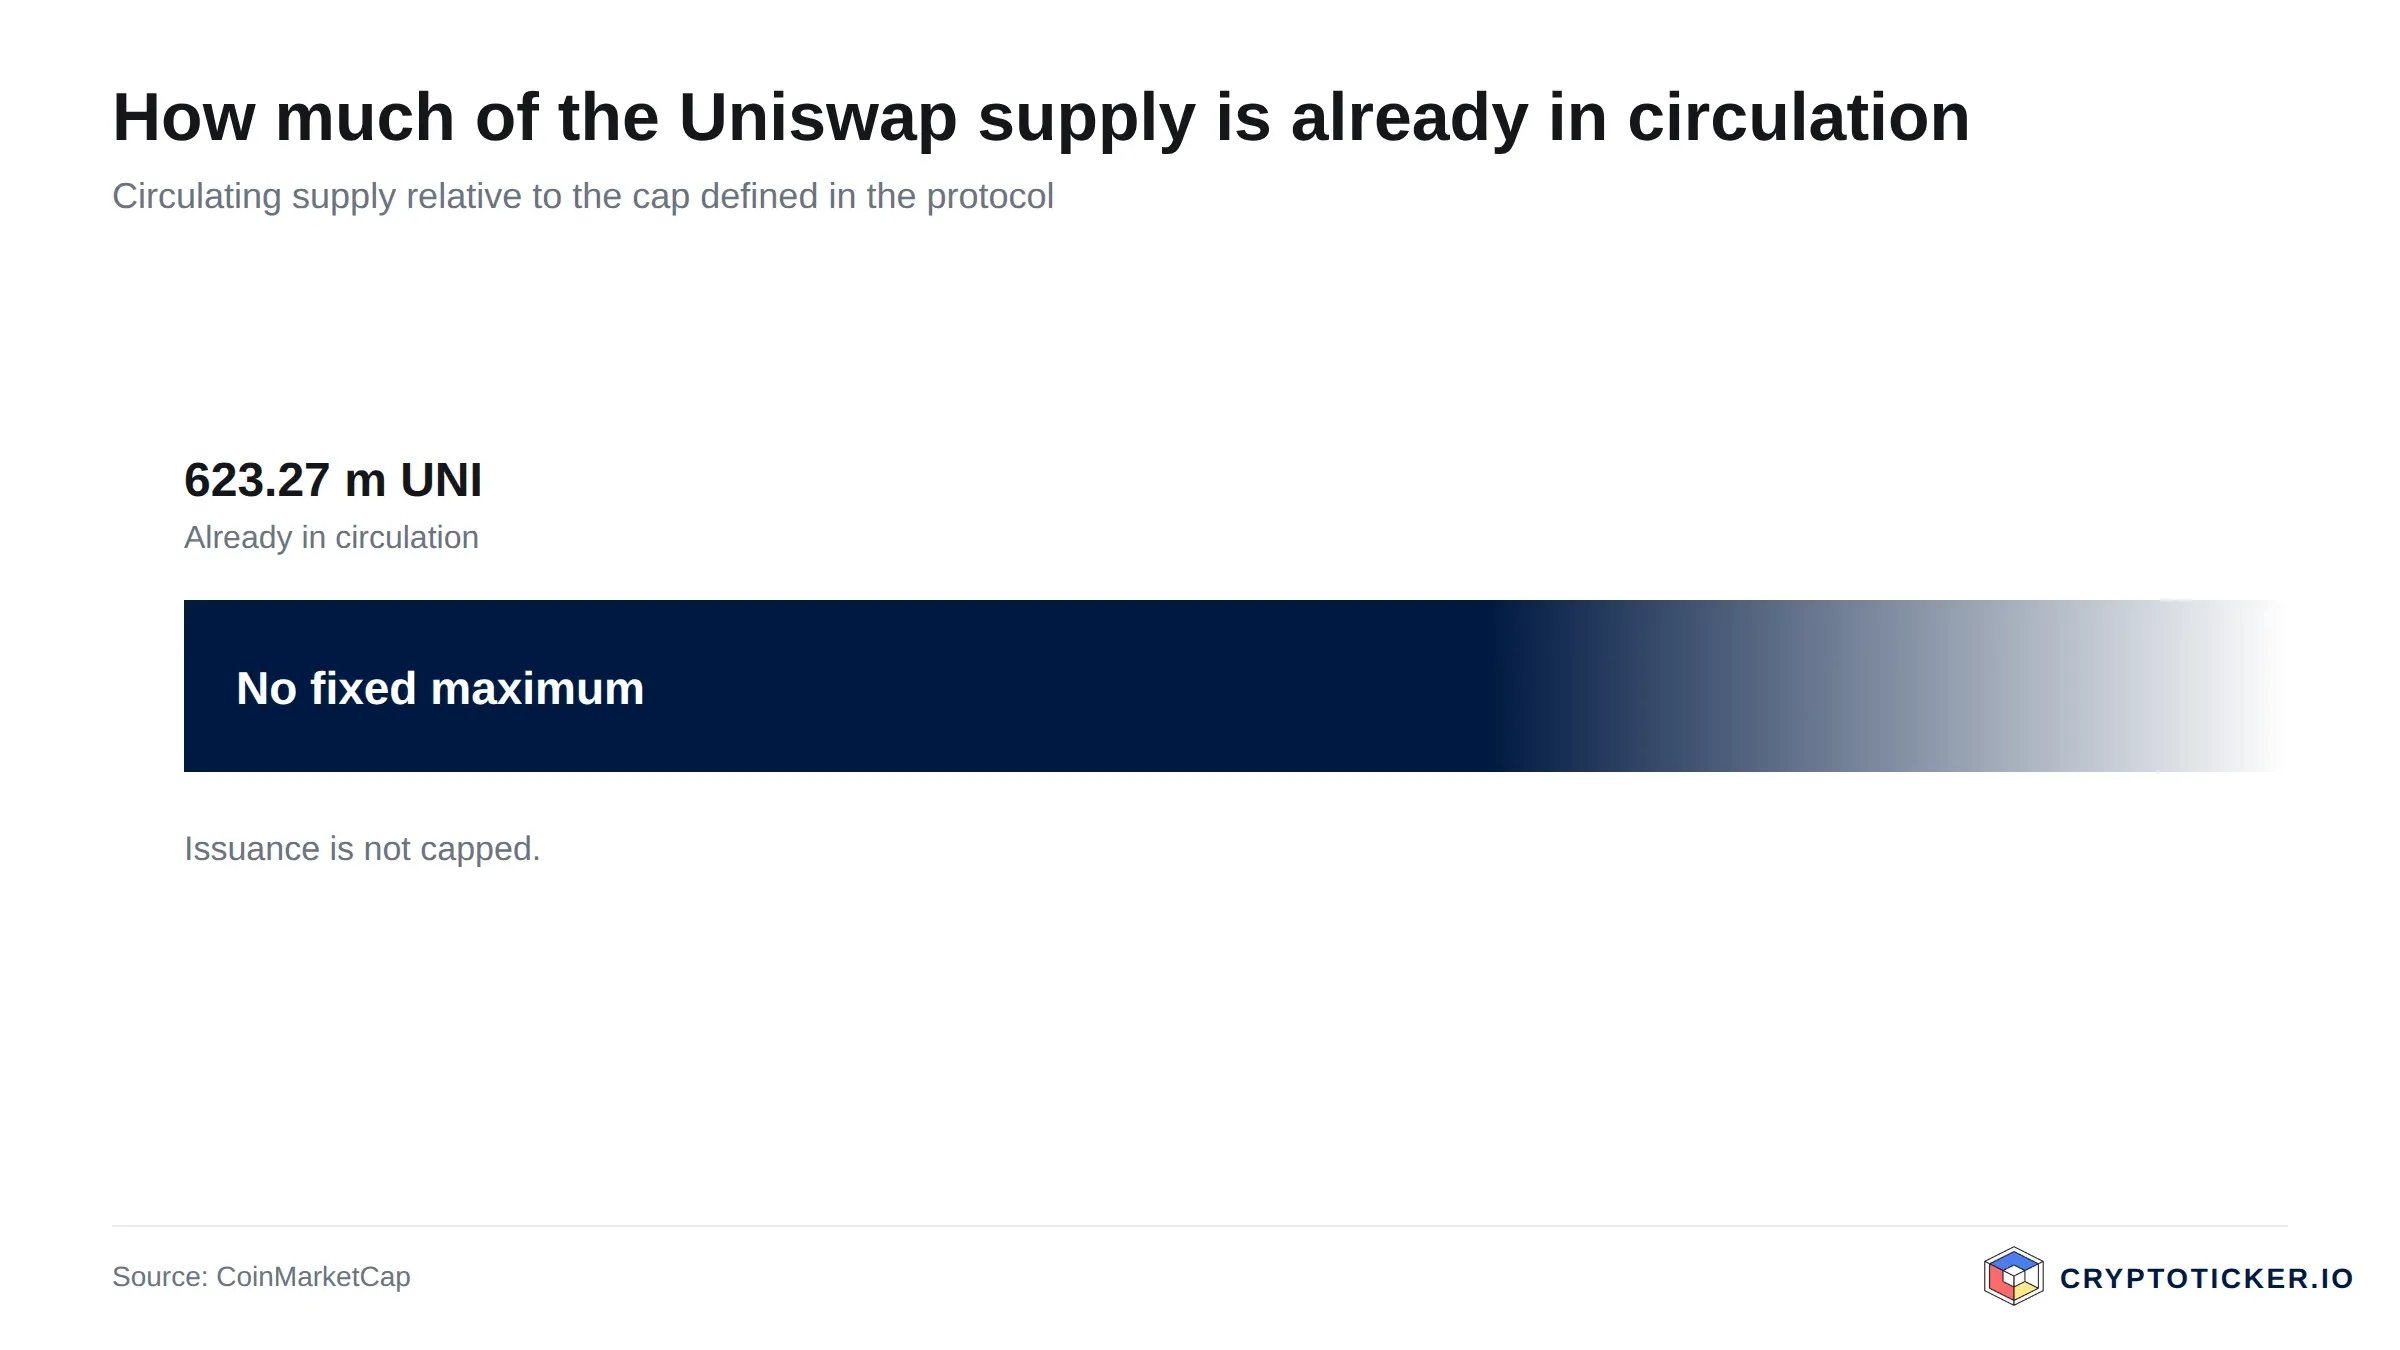
The third objection is specific to the token. About 623.27 million UNI are in circulation out of a total supply of about 890.52 million, and no maximum supply is disclosed in the market data. That gap is a standing consideration for a multi-year position, and it sits alongside the unresolved question of how protocol fees relate to the token. Neither point argues that the protocol is weak; both argue that a claim on its success through UNI is less direct than it appears.
Holding UNI for longer? Then custody needs settling. Wallets compared
How to buy Uniswap at the current price
UNI is listed on effectively every large regulated exchange serving European investors, so the practical questions are cost, custody and the standing of the venue. On cost, the spread matters more than the headline fee at this liquidity: zero commission with a wider spread can be dearer than a few tenths of a percent charged explicitly. The terms sit side by side in our crypto exchange comparison, and those weighting supervision will find that criterion isolated in the comparison of regulated exchanges. The venues we have examined most closely are covered individually: our Kraken review, the Bitpanda review and the Bitvavo review.
On custody, the decision follows the holding period. For a position to be traded within weeks, exchange custody is a reasonable trade-off; for a multi-year holding it is a counterparty risk taken for no return, and hardware storage is the usual answer. The devices are compared in our hardware wallet comparison. One point is specific to UNI: holding the token confers governance rights, not a share of trading activity, and investors interested in decentralised trading itself may find our perpetual DEX comparison closer to what they want.
Is Uniswap a good buy at current prices, short term and long term?
On a short horizon the evidence argues for patience. An RSI of 65.5, a gain of 34.2 percent in a week, a distance of 18.8 percent to the 50-day average at 3.70 dollars and a sentiment index at 81 all point the same way: the immediate move is largely priced. That does not say the trend fails. It says an entry at 4.39 dollars pays for a repricing already made, and that a test of the 200-day line at 3.98 dollars, an ordinary event in a healthy uptrend, would offer the same exposure roughly 9 percent cheaper. The assessment is wrong if the market runs on without such a test.
On a multi-year horizon the picture is more favourable. A price 59.8 percent below the twelve-month high of 10.93 dollars, a protocol with measurable usage, and turnover at about 1.5 times its twelve-month median describe an asset with a working business behind it trading well below its own recent valuations. The conditions under which that view fails are specific: decentralised exchange volume migrating away from the protocol, or the governance question about fees resolving in a way that leaves the token disconnected from the activity it governs. Neither is visible on a chart.
Neither answer is a recommendation. UNI at 4.39 dollars is an asset in a repaired but stretched position, above its 200-day average of 3.98 dollars, far above its twelve-month low of 2.40 dollars and far below its twelve-month high of 10.93 dollars, with an open question at the token level.
Buying Uniswap: what to take away
- The downtrend is broken but the entry is stretched. UNI at 4.39 dollars trades above the 200-day average of 3.98 dollars and the 50-day average of 3.70 dollars, with an RSI of 65.5 after a 34.2 percent week. The level to watch on a pullback is 3.98 dollars; the venues are set out in our crypto exchange comparison.
- The move is funded by real turnover. Seven-day volume of about 339.8 million dollars against a twelve-month median of about 225.1 million separates this advance from the low-volume bounces that failed earlier in the year. Investors weighting supervision as heavily as cost will find that criterion in our comparison of regulated exchanges.
- The open question sits at the token, not the protocol. With about 623.27 million of a total 890.52 million UNI in circulation and the link between fees and token holders still a matter of governance, a multi-year position needs a view on that and a custody arrangement to match; see our hardware wallet comparison.
Disclosure: Some of the providers mentioned in this article work with us through partner programmes. This has no influence on the price analysis or on the assessment of the chart situation; the price data comes from a public market data
(As of 25 August 2026. This article is not investment advice. Prices, fees and terms change; check them with the provider before every purchase. Crypto assets are subject to high price volatility and a total loss is possible.)
Transparency note: This article was produced with the assistance of artificial intelligence and reviewed by our editorial team before publication. All figures and claims were checked against the primaryI
More from CryptoTicker
Source: cryptoticker.io