


Don't want to trade it yourself?
Our desk runs DEX portfolios on profit share.
Currencies38933
Market Cap$ 2.70T-2.78%
24h Spot Volume$ 42.37B+5.41%
DominanceBTC57.40%-0.59%ETH10.82%-0.27%
ETH Gas0.15 Gwei
MarketAnalysisEthereumAltcoinTop StoriesEthereum EtfEthereum Price PredictionETH PriceEthereum ETFs
Aug 28, 2026
3min read
byRupam Roy
forThe Coin Republic

Ethereum traded around $2,519 after reclaiming the $2,500 level (session high $2,558.47) and has gained 10.6% over seven days and 34.3% over 30 days; an analyst says a weekly close above $2,550 could target $3,000 with intermediate resistance at $2,800 and immediate support at $2,500–$2,490. ETF demand has underpinned the move, with eight consecutive inflow sessions from Aug 17–26 totaling ~$1.185 billion (Aug 26 net $192.35M), cumulative ETF inflows of $12.64B and total net assets of $15.13B, while reported fund accumulation included ~385,633 ETH ($961M) and 27,722 BTC ($2.2B). Derivatives show $149.49M in 24h liquidations, $106.48M from shorts, suggesting a short squeeze and bullish pressure that could support ETH price and broader crypto adoption across CEX and DeFi venues, though a sustained rally is not guaranteed.
See what traders are focused on

Key Insights:
- Ethereum price prediction: A weekly close above $2,550 could strengthen the case for advance.
- Ethereum ETF inflows reached $1.185 billion across eight sessions.
- Heavier short liquidations signal mounting bullish pressure.
Ethereum price traded at $2,519 after recovering from a dip toward $2,490 and reclaiming the $2,500 level. However, the price was still below its $2,558.47 session high at press time. The latest advance stalled around $2,525–$2,530. A sustained move above this immediate resistance zone could bring $2,540 and the session peak into focus.
Alongside that intraday recovery, Ethereum’s performance metrics showed gains of 10.6% over seven days and 34.3% over 30 days.
Ethereum Price Prediction Shows Possible Move to $3,000
In his Ethereum price prediction, crypto analyst Ted links a potential rally toward $3,000 to a weekly close above $2,550. However, the weekly candle is still open, leaving the breakout unconfirmed after Ethereum extended the previous week’s sharp recovery.
Meanwhile, Ted’s weekly chart shows Ethereum just below the $2,547–$2,550 resistance zone, with the latest candle gaining 2.98%. His chart marks $2,800 as an intermediate hurdle, with a breakout there strengthening the case for further upside.
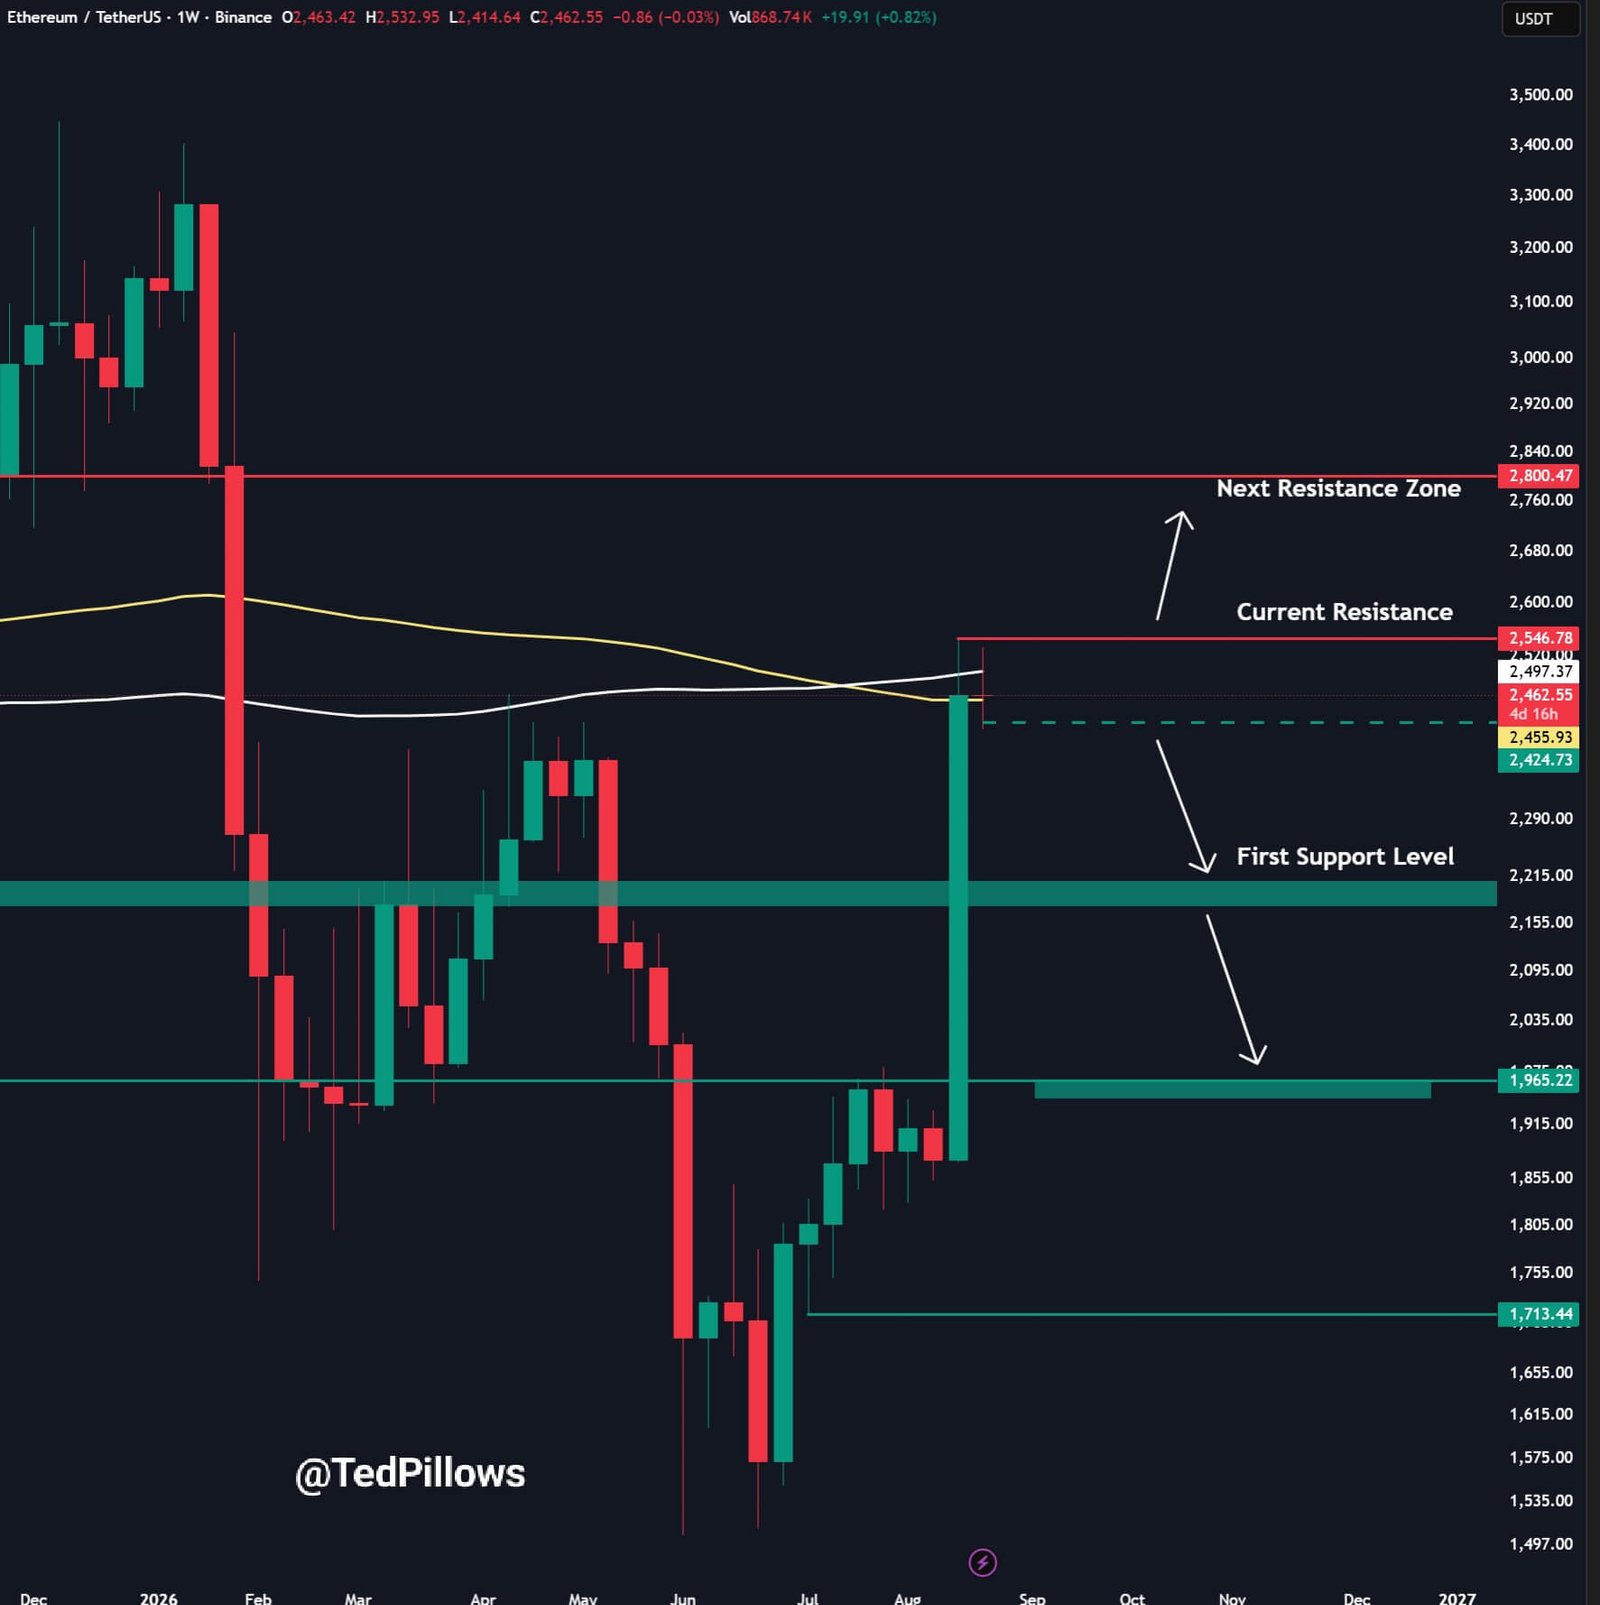
Conversely, immediate support sits at $2,500, followed by the nearby zone between $2,480 and $2,490. Losing that zone could expose $2,460, then the daily low at $2,439.43.
On the weekly chart, rejection near resistance could redirect attention toward the dashed $2,425 level. Below that, marked support zones sit around $2,190 and $1,965, with deeper support at $1,713.
Ethereum ETF Inflows Extend Eight-Session Run
Alongside that recovery, Ted reported net inflows into Ethereum ETFs totaling $192.35 million during the August 26 trading session. The accompanying flow table records eight consecutive positive trading sessions, attracting approximately $1.185 billion from August 17 through August 26.
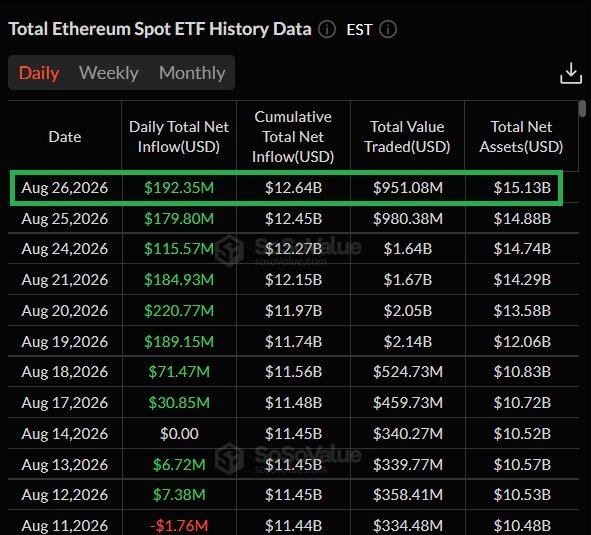
Within that stretch, the latest three trading days contribute $487.72 million. It reflects continued demand for exposure through Ethereum ETFs. Beyond those subscriptions, cumulative net inflows reach $12.64 billion, while the funds’ total net assets stand at $15.13 billion.
Meanwhile, the data show trading volume fell slightly to $951.08 million, down from $980.38 million in the previous session. Consequently, the latest session records higher net inflows despite the decline in overall trading turnover.
Regarding that session’s allocation, Ted attributes $115.66 million to BlackRock, representing approximately 60.1% of the total daily net inflow. However, the accompanying screenshot does not display individual fund flows, so it cannot independently confirm BlackRock’s reported share.
Separately, Lookonchain’s on-chain tracking data show that BlackRock’s crypto funds accumulated Bitcoin and Ethereum over eight consecutive trading days.
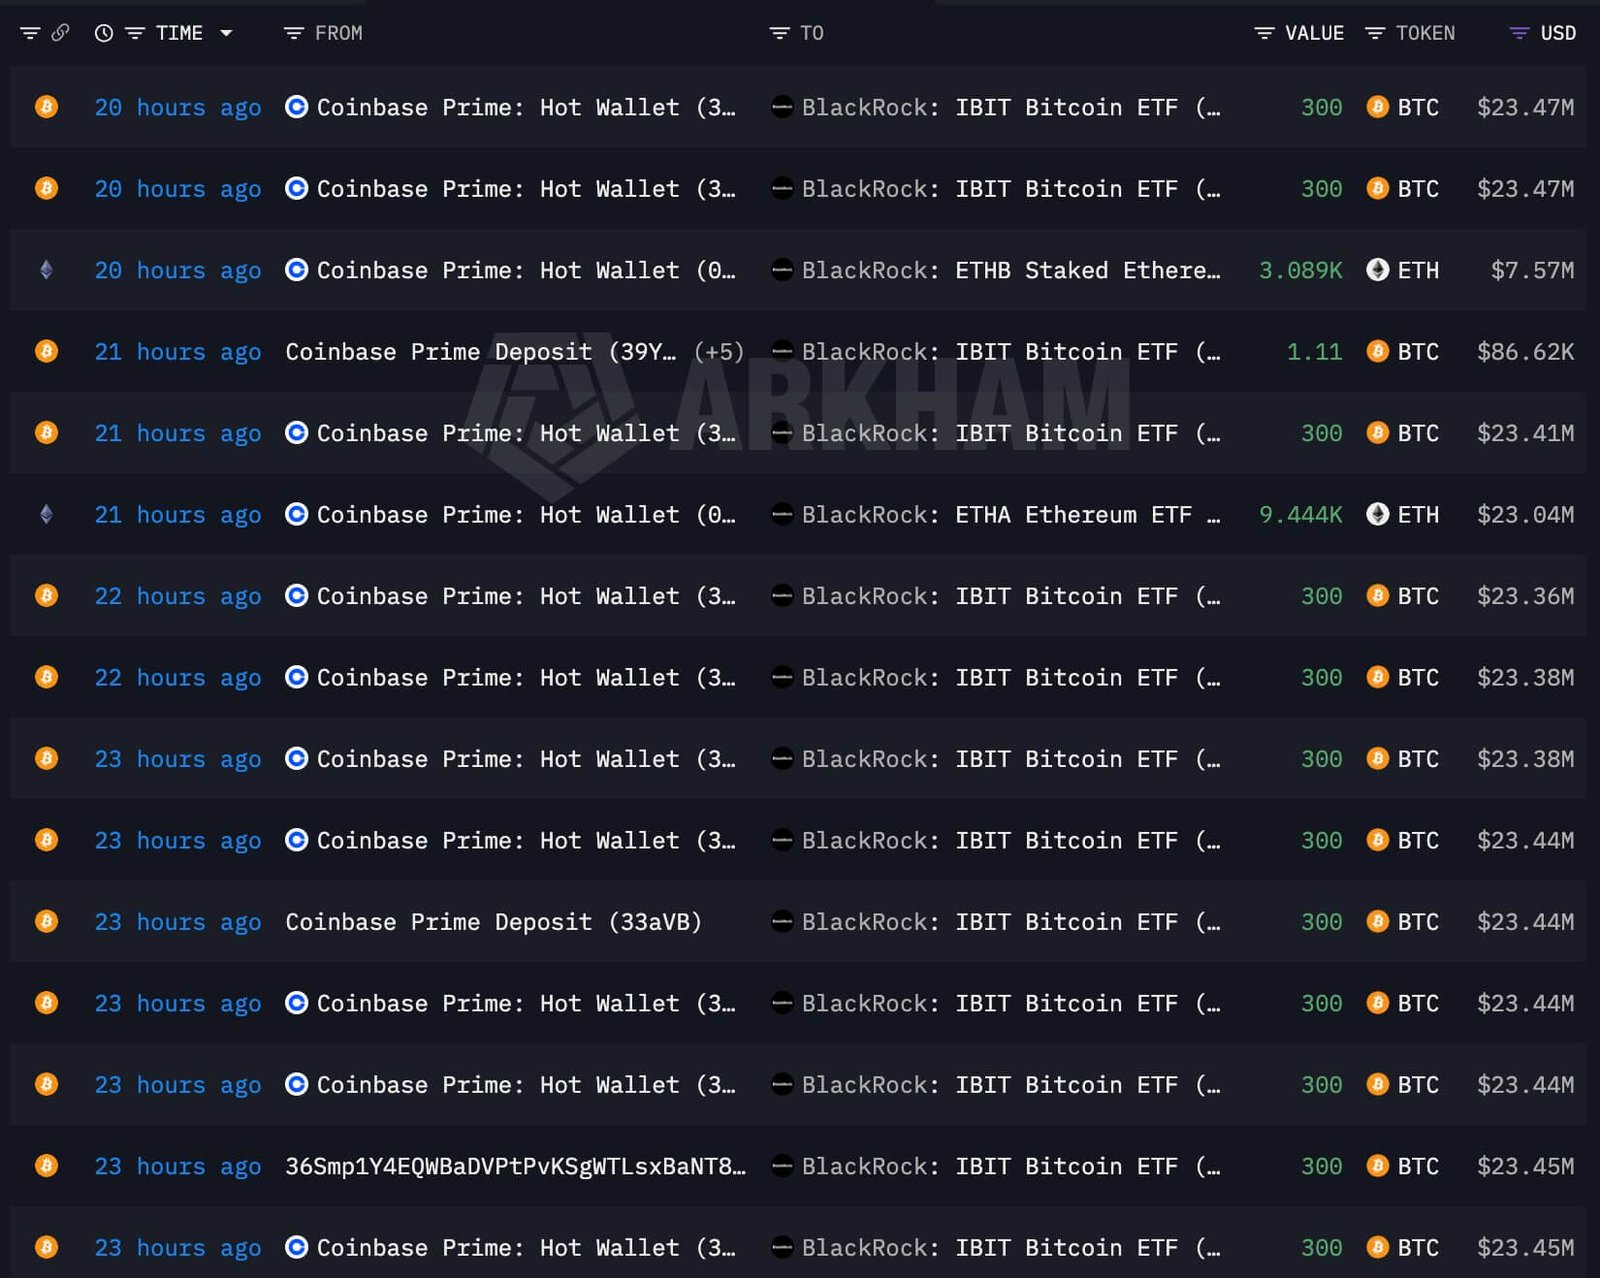
Those reported additions include 27,722 BTC valued at $2.2 billion and 385,633 ETH valued at $961 million. Together, the two assets account for approximately $3.16 billion in additions across the funds covered by the update.
Those continued inflows could absorb selling pressure across both cryptocurrencies, although the additions do not guarantee higher market prices.
Alongside those fund flows, Ethereum liquidations total $149.49 million across long and short positions during the displayed 24-hour period. Within that total, short positions account for $106.48 million in liquidations, compared with $43.01 million from long positions.
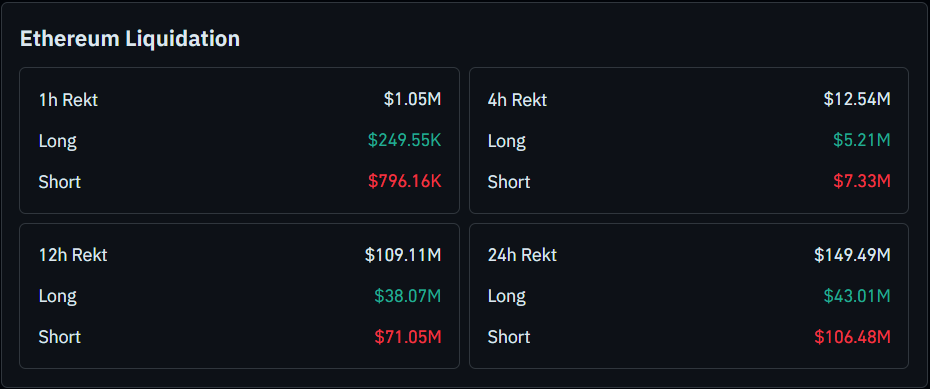
That imbalance indicates greater pressure on traders positioned for price declines, consistent with a short squeeze. However, the liquidation data alone cannot establish whether Ethereum’s latest recovery will develop into a sustained price rally.
Over shorter periods, the latest 12 hours total $109.11 million, followed by $12.54 million over the latest four hours. During the final hour, liquidations total $1.05 million, suggesting pressure eases after a heavier burst earlier in the period.
Source: cryptorank.io