


Don't want to trade it yourself?
Our desk runs DEX portfolios on profit share.
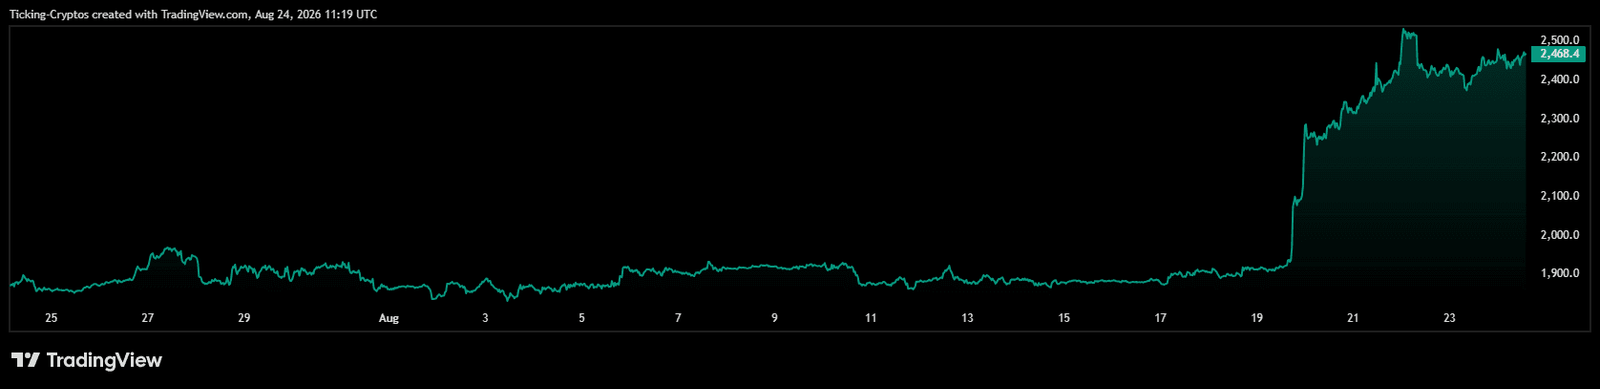
Ethereum trades at $2,472 as of 24 August 2026, up 0.38% on the day and roughly 28% over the past seven sessions. That is the strongest weekly performance ETH has printed all year, and it came out of nowhere for anyone who was not watching the macro tape.
Three catalysts stacked on top of each other in the space of 48 hours. The US Treasury announced it would at least double its buybacks of longer-dated government debt, lifting the operation size from around $2 billion to $4 billion. That pushed long-end yields lower and reopened the risk appetite window that crypto had been locked out of since spring. Almost simultaneously, the SEC published a proposed framework letting crypto projects raise capital under defined exemptions and exit securities classification once core managerial commitments are met, and President Trump publicly pressured the Senate to move on the Clarity Act, which is now scheduled for a procedural vote in September.
The market was positioned exactly wrong for all of it. More than $3 billion in leveraged crypto positions were wiped out in 24 hours, with short positions accounting for roughly 92% of the damage, around $2.77 billion. That is the fuel behind the vertical candle you see on the chart. $ETH went from below $1,950 to an intraday peak near $2,546 on 22 August, and it has held most of that ground since.
Institutional flow is confirming rather than fading the move. Spot Ether ETFs pulled in $71.47 million on 18 August with BlackRock’s ETHA taking $64.68 million of it, and 30-day inflows reached $524.3 million. On the protocol side, the Ethereum Foundation activated the Platåberget public testnet on 17 August as the staging ground for Glamsterdam, targeted for Q4 2026.
So the fundamental backdrop is genuinely better than it was three weeks ago. The question is whether the chart can absorb a 29% move without giving it all back.
What does the Ethereum chart say right now?
ETH has flipped from a downtrend to a confirmed bullish structure for the first time since February, but it is doing so in deeply overbought territory.
The 200 EMA sits at $2,139.36 and had acted as a ceiling for the entire summer, sloping down and capping every rally attempt from May through mid-August. Price spent June crashing to roughly $1,512, then July and early August grinding sideways in a $1,850 to $1,980 box.
The breakout candle did not just clear the 200 EMA. It cleared $2,200 and $2,430 in a single session, which is three separate structural levels in one move. Price is now trading 15.6% above the 200 EMA, and the moving average itself has started to curl upward for the first time in months.
That is the bullish read. Here is the caveat: RSI (14) prints 79.30 against its own signal line at 65.00. Anything above 70 is overbought, and 79 on the daily is the kind of reading that usually resolves through either a sharp pullback or an extended sideways cooling period. It rarely resolves by simply continuing straight up.
There is also the shape of the move to consider. The candle from $1,950 to $2,300 is close to vertical, which means there is almost no traded volume in that band. Thin ranges like that tend to get revisited eventually, because there are no resting bids inside them to slow a decline.
What are the upside targets for ETH?
$3,000 is the objective this structure points to, but it is a Q4 target reached in three steps, not a two-week move.
Start with why $3,000 is the number worth watching rather than an arbitrary round figure.
Measure the entire bear leg from the August 2025 all-time high near $4,950 down to the June 2026 low around $1,512. That is a range of roughly $3,438. The 0.382 retracement of that decline sits near $2,825 and the 0.50 retracement sits near $3,231. In other words, $3,000 falls almost exactly in the middle of the standard recovery band for a move of this size. It is also the round number that carries the heaviest resting order flow, and it sits inside the zone where ETH spent significant time trading in early 2026 before the breakdown, meaning there is real historical volume anchoring it rather than empty air.
From the current $2,472, that is a 21% move. For context, Ethereum just delivered 29% in a single week, so the magnitude itself is not the obstacle. The sequencing is.
Here is the path in order.
- Step one, $2,546. The swing high from 22 August. ETH tagged it, rejected, and has been building a tight range between roughly $2,424 and $2,483 since. Nothing happens on the upside until this clears on a daily close.
- Step two, $2,750. Above the swing high the chart is clean all the way to this level, marked as the upper yellow band. It was the last meaningful supply zone before the spring breakdown. This is the genuine test, because it is the first place where trapped sellers from the earlier decline get their chance to exit at breakeven. Expect the move to stall here at least once.
- Step three, $3,000. Only reachable if $2,750 breaks on expanding volume rather than a low-volume wick. On the chart above, this level sits off the top of the visible range, which is worth stating plainly: it is an extension target, not a level currently being tested.
The honest framing on that upper target is that it requires the macro tailwind to persist. Specifically, it needs the Clarity Act procedural vote in September to go the market’s way, and it needs ETF inflows to keep running above $70 million a day rather than flattening out the way they did in mid-August. If either of those breaks down, $2,750 caps the move and $3,000 stays theoretical.
Where is support if Ethereum pulls back?
$2,430 is the first line, $2,200 is the real test, and $2,139 at the 200 EMA is where the bull case actually lives or dies.
Work down the chart in order.
- $2,430 is the immediate flip level. It was resistance on the way up and price is currently using it as a floor. Losing it on a daily close signals the breakout is being sold rather than absorbed.
- $2,200 is the next horizontal. This is a level ETH respected repeatedly in May before the breakdown, and it sits right at the midpoint of the August spike. A retest here would be normal and healthy, and it would work off the RSI overbought condition without breaking anything structurally.
- $2,139.36 is the 200 EMA and the single most important number on the chart. Ethereum spent four months below it. Falling back under it would reclassify the entire August move as a liquidation-driven spike rather than a trend reversal, and it would put $2,000 back in play immediately.
Below that, the air gets thin fast. The $1,900 area was the July and August base, and $1,800 is the horizontal that held through the whole summer recovery. A move to $1,800 would mean the macro trade unwound entirely, and realistically that requires the Treasury liquidity story to reverse or the Clarity Act to die in the Senate.
Is the ETH breakout sustainable or is this a squeeze?
It is both, and that is exactly why the next two weeks matter more than the last two.
Short squeezes are real price discovery, but they are not organic demand. The $2.77 billion in liquidated shorts created forced buying that has now largely exhausted itself. What replaces it determines the next leg.
The bullish evidence for sustainability: ETF inflows continued through and after the squeeze rather than reversing, corporate treasury accumulation is ongoing with BitMine holding roughly 5.82 million ETH or about 4.8% of supply, and the regulatory catalysts are forward-looking rather than already priced.
The bearish evidence: derivatives leverage has already reset once, with mid-August deleveraging cutting around $3 billion in open interest, and analysts have flagged concentrated leveraged positions on Aave as a hidden liquidation risk if price moves sharply in either direction. $Ethereum also remains roughly 50% below its August 2025 all-time high near $4,950, so there is a great deal of trapped supply overhead as price climbs.
The clean tell is the monthly close. August closes on Sunday. A monthly candle that closes above $2,400 means the market absorbed the breakout. A close back below $2,200 means it was sold into.
Ethereum price prediction summary
- Base case: ETH consolidates between $2,400 and $2,550 into early September, works the RSI back toward 60, then attempts $2,750 once the September Clarity Act vote clears. This is the most likely path, and it puts $3,000 in reach late in Q4 rather than this month.
- Bull case:a daily close above $2,546 on strong volume takes ETH to $2,750 within two weeks. Clearing $2,750 opens $3,000, which lines up with the 0.382 to 0.50 retracement band of the entire bear leg and would coincide with Glamsterdam anticipation building into Q4.
- Bear case: failure to hold $2,430 triggers a retrace into the thin $2,200 zone. Losing the 200 EMA at $2,139 invalidates the reversal, reopens $1,900, and takes $3,000 off the table entirely.
The level that decides everything is $2,139. Everything above it is a bullish structure with a pullback risk. Everything below it is a failed breakout.
Source: www.kucoin.com
4 Comments
Pingback: Can Bitcoin Hit $89K? – xpertsstudio
Pingback: Sells Strategy and Coinbase, Buys Robinhood – xpertsstudio
Pingback: Bitcoin Surges In Strongest Weekly Gain Since 2023 – But This One Key Trading Metric Is Drawing Attention – xpertsstudio
Pingback: Ethereum Based DeFi Lending Protocol Term Finance Suffers Setback As Governance Exploit Drains Millions From Vaults – xpertsstudio