


Don't want to trade it yourself?
Our desk runs DEX portfolios on profit share.
Ethereum price has risen 1.9% over the past 24 hours to around $2,443, keeping $ETH just above its 20-day exponential moving average as buyers returned following this week’s selloff.
CoinGecko puts $ETH’s 24-hour range between roughly $2,371 and $2,441, with the token recovering from the lower end of that range as of Sept. 17.
$ETH remains down 1.6% over the past seven days, although its 30-day gain stands at 28.7%.
The recovery follows a sharp decline earlier this week, when $ETH fell towards $2,370 as crypto markets came under pressure after the US Senate failed to advance the CLARITY Act.
<a href="https://xpertsstudio.com/bitcoin-mining-stocks-rally-outpacing-bitcoin/” title=”Bitcoin mining stocks rally, outpacing Bitcoin'…”>Bitcoin fell close to a four-week low during the selloff, while Ethereum dropped more than 6% on Sept. 15.
Ethereum has since separated from some of the weakness across the crypto market, with an upgrade to the network’s block construction process and continued institutional accumulation providing $ETH-specific catalysts.
Multi Party Block Construction went live on Ethereum mainnet on Sept. 16, allowing several builders to contribute transactions to a single block.
Under the existing proposer builder separation model, builders assemble blocks and compete to have them selected by validators.
MPBC keeps the existing proposer selection process but allows other builders to append eligible transactions before the block reaches the proposer, resulting in improved transaction inclusion and reduced dependence on a single builder for block contents.
The change operates at Ethereum’s infrastructure layer and does not alter $ETH’s supply or directly create demand for the token.
Its Sept. 16 launch has, however, given the market an Ethereum-specific development while other major cryptocurrencies remain under pressure.
Corporate $ETH purchases have continued at the same time.
BitMine Immersion Technologies increased its treasury to 5,956,378 $ETH after buying another 27,180 $ETH during the previous week, according to the company’s Sept. 14 disclosure.
Its holdings now represent roughly 4.9% of Ethereum’s 122 million token supply.
BitMine is close to its stated target of holding 5% of the $ETH supply. Of its holdings, 5,067,309 $ETH were staked as of Sept. 7, equivalent to roughly 85% of its current position.
However, demand through US spot Ether exchange-traded funds has been less consistent.
Farside Investors recorded $216.4 million in net inflows on Sept. 11 and another $121.1 million on Sept. 14, before the funds posted $142.3 million in net outflows on Sept. 15.
Recent ETF flows therefore do not account for the latest $ETH recovery on their own, with the Sept. 15 outflow coming as crypto prices fell following the Senate vote.
$ETH price analysis
$ETH’s daily price has recovered to roughly $2,444 after falling towards $2,370, leaving the token slightly above its 20 day EMA at $2,434.49.
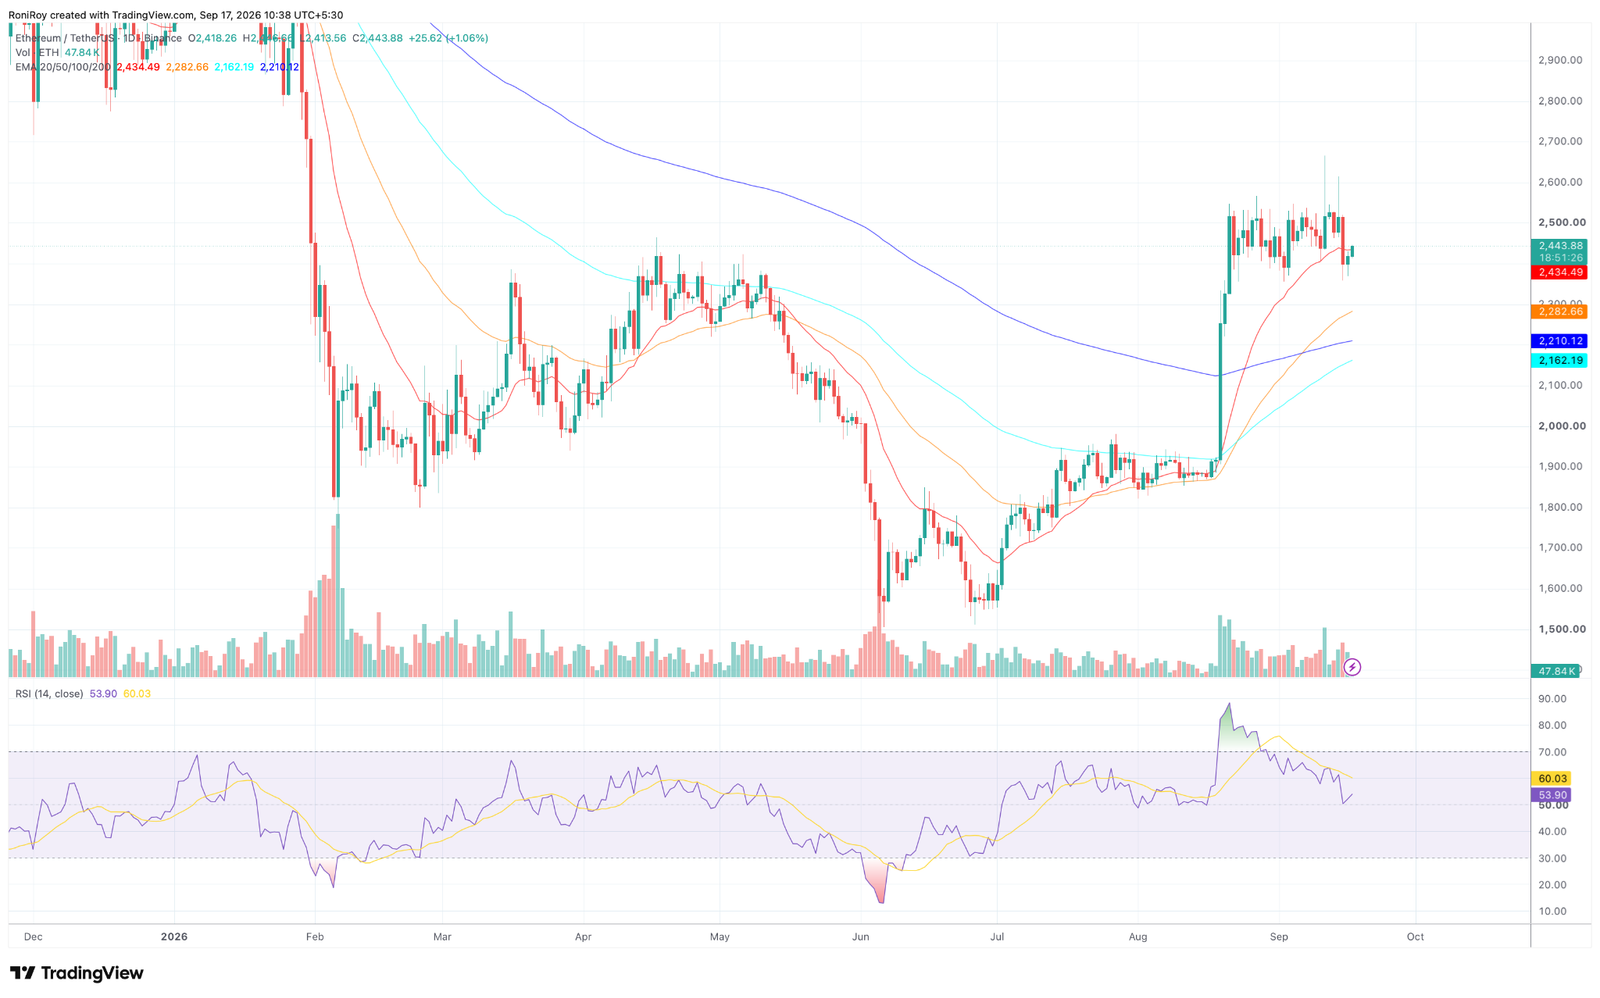
Holding above that moving average keeps the immediate recovery intact, but price remains below the $2,500 area where several daily candles were rejected earlier this month.
The other daily moving averages remain well below the current price. The 50-day EMA stands at $2,282.66, followed by the 200-day EMA at $2,210.12 and the 100-day EMA at $2,162.19.
$ETH’s sharp August breakout pushed price above all four averages, and the 20 day EMA has now become the closest level that could determine whether the latest pullback extends.
A daily close below $2,434 would put the recent low around $2,370 back in focus. If sellers break that level, the next major area sits near the 50-day EMA at $2,283.
A move towards that average would erase a large part of the distance $ETH opened above its medium term trend during the August rally.
Daily RSI has fallen to 53.90 from readings above 80 following the August breakout.
The indicator remains above the neutral 50 level but has dropped below its RSI moving average at 60.03, showing that the speed of the earlier price rise has slowed even though $ETH remains above its main daily EMAs.
A sustained move back above $2,500 would put the September highs around $2,550 in view.
$ETH has repeatedly traded around $2,500 since late August but has struggled to remain above the area, making $2,500 to $2,550 the main resistance zone before the August wick near $2,650.
On the 4 hour chart, $ETH has rebounded from the Sept. 16 low and returned to roughly $2,444, but the latest candles remain below the cluster around $2,480 to $2,500 that preceded the selloff.
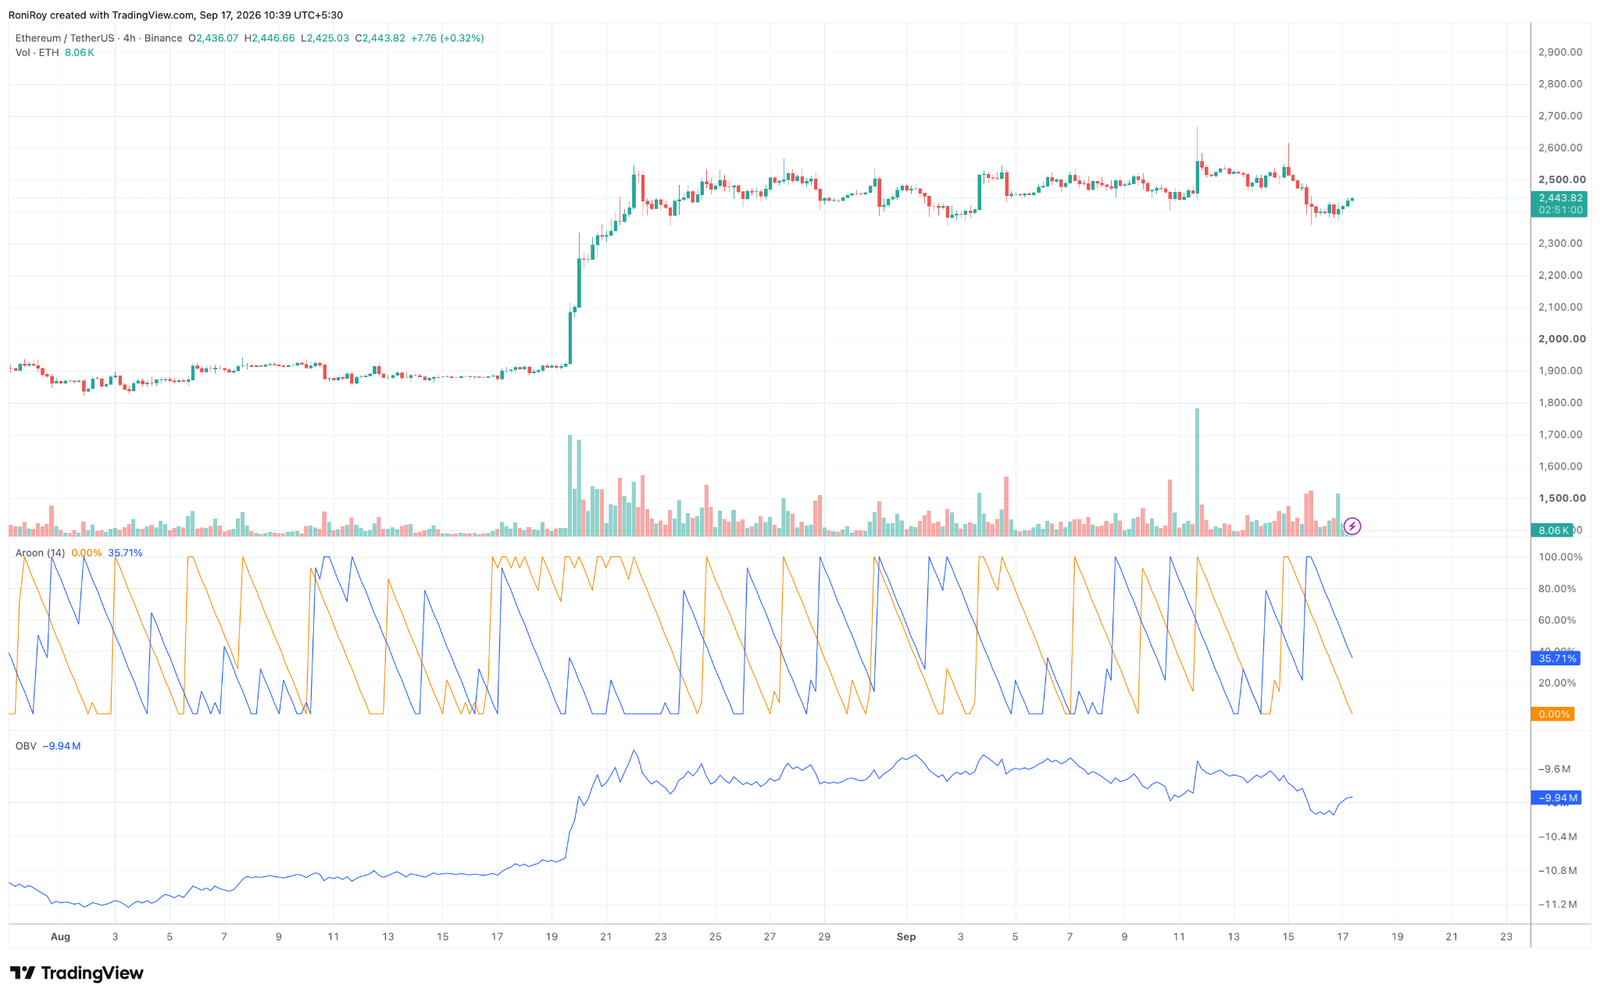
Aroon Up stands at 35.71%, while Aroon Down has fallen to 0%.
Aroon Down’s move to zero indicates that the recent low is becoming less dominant within the indicator’s 14 period window, although Aroon Up at 35.71% has yet to show a recent high strong enough to confirm a fresh four hour breakout.
OBV sits near negative 9.94 million after falling sharply during the Sept. 15 and Sept. 16 decline.
The indicator has started to turn higher alongside $ETH’s rebound, but it remains below the levels recorded before the selloff.
A continued rise in both price and OBV would give the recovery towards $2,480 to $2,500 stronger volume support.
If $ETH clears $2,500, the next resistance lies around $2,550, followed by the August spike near $2,650.
Failure to hold the daily 20-day EMA at $2,434 would expose $2,370 to $2,400 first, while a break below the recent low would bring the 50-day EMA near $2,283 into range.
Source: cryptonews.net