

Don't want to trade it yourself?
Our desk runs DEX portfolios on profit share.
Add to Google Preferred Sources
The Crypto Fear and Greed Index surged from 27 on Aug. 12 to 74 on Tuesday, its highest level since October 2025, before easing to 65 on Wednesday. The rapid shift from fear to greed accompanied <a href="https://xpertsstudio.com/blackrock-drives-431-million-into-bitcoin-and-ether-etfs/” title=”Blackrock Drives $431 Million Into Bitcoin and Ether ETFs”>Bitcoin‘s climb from below $68,000 to nearly $80,000, with some major tokens gaining as much as 70% and smaller memecoins posting triple-digit weekly advances. The last time the index reached similar levels was five days before a crash that liquidated roughly $19 billion in leveraged positions. Analysts note that daily RSI readings around 84 suggest the rally may be overextended, with resistance sitting between $82,000 and $83,000. The next major test for markets comes Friday, when Federal Reserve Chair Kevin Warsh delivers his first Jackson Hole keynote as chair, with traders seeking signals on rates and inflation.
Key Elements
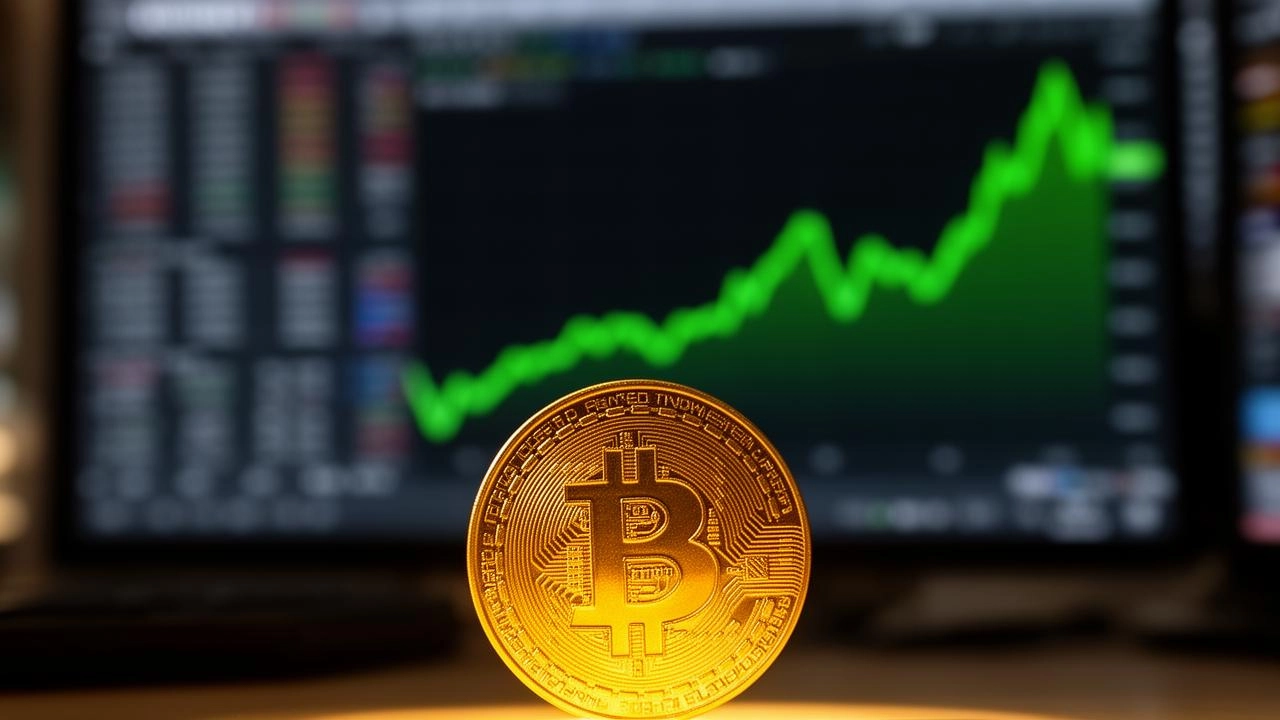
Cryptocurrency investors have staged one of the fastest mood reversals in recent market history, pushing a widely followed sentiment gauge from deep fear to greed in under two weeks as Bitcoin surged toward the $80,000 mark.
The Crypto Fear and Greed Index climbed to 74 on Tuesday, its highest reading since Oct. 5, 2025, just five days before a market crash erased roughly $19 billion in leveraged positions in a single session. The index, which had languished at 27 on Aug. 12, eased to 65 on Wednesday, still firmly in greed territory. It had spent every day from late July through Aug. 19 in the fear zone, bottoming at 25 on Aug. 6 — a level the index classifies as extreme fear.
The gauge blends bitcoin’s volatility and trading momentum, which carry the most weight, with social media activity, bitcoin’s share of total crypto value and Google search interest. Scores above 50 indicate greed, while readings above 75 signal extreme greed. The index measures current market mood rather than predicting future moves, but the speed of the shift has caught the attention of analysts.
Bitcoin traded around $79,000 on Wednesday after peaking above $81,000 in the previous session, marking its fastest weekly advance in roughly five years. The rally began on Aug. 19 after the U.S. Treasury announced it would double purchases of longer-dated government bonds, a move that weakened the dollar and revived appetite for scarce assets. Billions of dollars in bearish bets were wiped out as the price ran higher, and open interest in Bitcoin-denominated futures fell to a five-month low, suggesting forced short covering played a larger role than fresh leverage.
A thick band of resistance now sits between $82,000 and $83,000. Daniela Hathorn, a senior market analyst at Capital.com, cautioned that Bitcoin faces a far higher bar to clear after its strongest weekly rally in years. The daily relative strength index reached about 84 on Tuesday, a reading that typically marks an exhausted move rather than a fresh one. Sentiment gauges have swung hard toward greed, reaching their highest levels in about 11 months.
One technical read argued that a retreat toward $69,700 would let Bitcoin test its 200-day simple moving average as support, a healthier outcome than an unbroken vertical run. Other analysts placed the next upside target near $95,000, but only if buyers take out $82,000 and hold it.
The rally has spread far beyond the largest cryptocurrency. Some major tokens gained as much as 70% as traders returned to the so-called debasement trade after months in which speculative attention had been dominated by AI, memory chips and semiconductor stocks.
Further down the market, the moves are larger still. Dogecoin has gained about 24% over the past week. Smaller memecoins have run far harder, with Thinking Cat up 131% over seven days, Cash Cat up 113% and Dog (Bitcoin) close to doubling. Money flowing into thinly traded tokens is a strong indication that risk appetite has returned, but such high readings can also signal that investors are getting carried away and that the market may be due for a correction.
The market’s next major test arrives Friday, when Federal Reserve Chair Kevin Warsh delivers his first Jackson Hole keynote as chair. Traders have almost no policy record to price against, which turns the speech into a two-way risk for crypto and the dollar. Investors are looking for clues on rates and inflation after weeks of volatility in long-term Treasury yields, whose recent retreat helped kick off bitcoin’s run from below $68,000.
Wednesday’s U.S. data calendar carries the July personal consumption expenditures price index alongside a revision to second-quarter growth, both of which feed directly into rate expectations and could shape positioning ahead of Warsh’s speech.
Bitcoin remains the month’s standout performer, climbing roughly 23% since Aug. 1 and heading for its best August since 2017, when it rose 65%. The historical median return for August is a loss of about 7%. The context behind that number is a long grind lower: Bitcoin peaked above $126,000 in October 2025, then spent most of 2026 sliding through a downtrend that ran about 10 months, changing hands below $63,000 as recently as mid-August. Even after the recent surge, the price remains far below where it stood a year ago.
Whether the current greed reading marks a top or merely a waypoint depends heavily on how the market absorbs the next round of macro signals. The last time the index sat at similar levels, the unwind was swift and brutal. But analysts caution that the gauge alone cannot forecast the future — it only shows how quickly sentiment has shifted from panic to euphoria.
Once added, BigGo Finance appears first in Google Search Top Stories, so you get the broadest, most up-to-the-minute, and most comprehensive global financial news first.
Source: finance.biggo.com