


Don't want to trade it yourself?
Our desk runs DEX portfolios on profit share.
Bitcoin Price Prediction: Can BTC Still Reach New Highs in 2026?
Bitcoin hovered near $79,900 on Sunday, Sept. 6, leaving $BTC within striking distance of a resistance area around $80,500 as traders assess whether the weekend rebound can extend. A rejection could send price back toward $78,500, while holding that support would keep a recovery toward $83,000-$84,000 in play.
Bitcoin Faces a Key Test Near $80,500
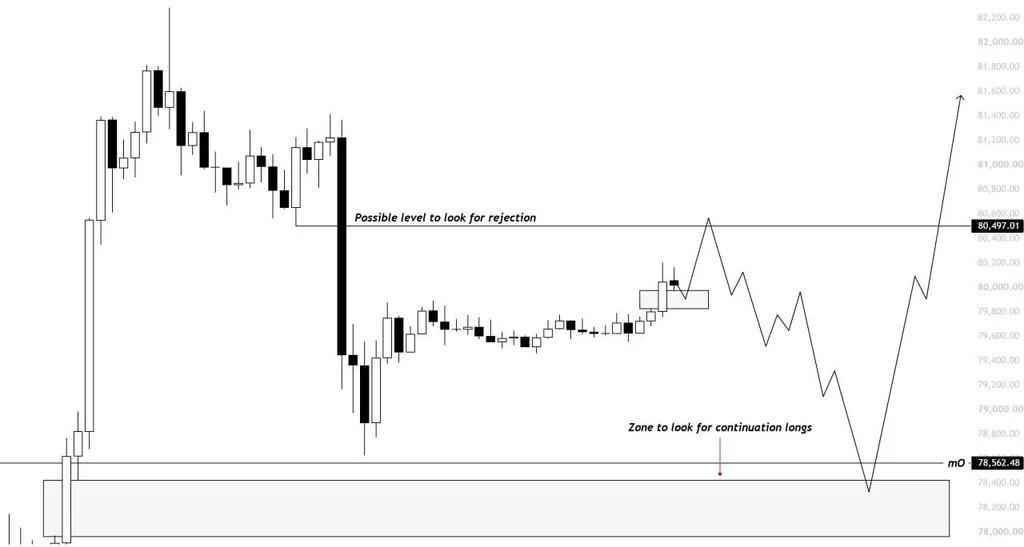
Bitcoin’s short-term recovery is approaching an area where sellers could regain control, with $80,497 marked as the main resistance level before a possible pullback.
Bitcoin $BTC 80.5K Rejection Level. on X
Kaz said the latest $BTC advance has come on relatively low volume, while bids have appeared near $78,500. His base scenario calls for Bitcoin to test roughly $80,500 to $80,800 before potentially retracing toward the $78,500 area.
The chart places $80,497 as the immediate rejection level. A failure to establish price above that threshold would support the case for another move lower, with $78,562 — marked as the monthly open — acting as the next important reference point.
A broader demand zone extends below that level toward roughly $78,000. Kaz views that area as a potential location for continuation longs if buyers defend it. Under that scenario, a pullback would represent a reset within the recovery rather than confirmation of another sustained decline.
The bullish case depends on support holding. A successful defense around $78,000-$78,500 followed by renewed buying would keep $83,000-$84,000 in view a clean breakdown through the demand zone would weaken the projected continuation and leave $BTC vulnerable to deeper support
Liquidity Builds Above Bitcoin as $78,000 Remains Important
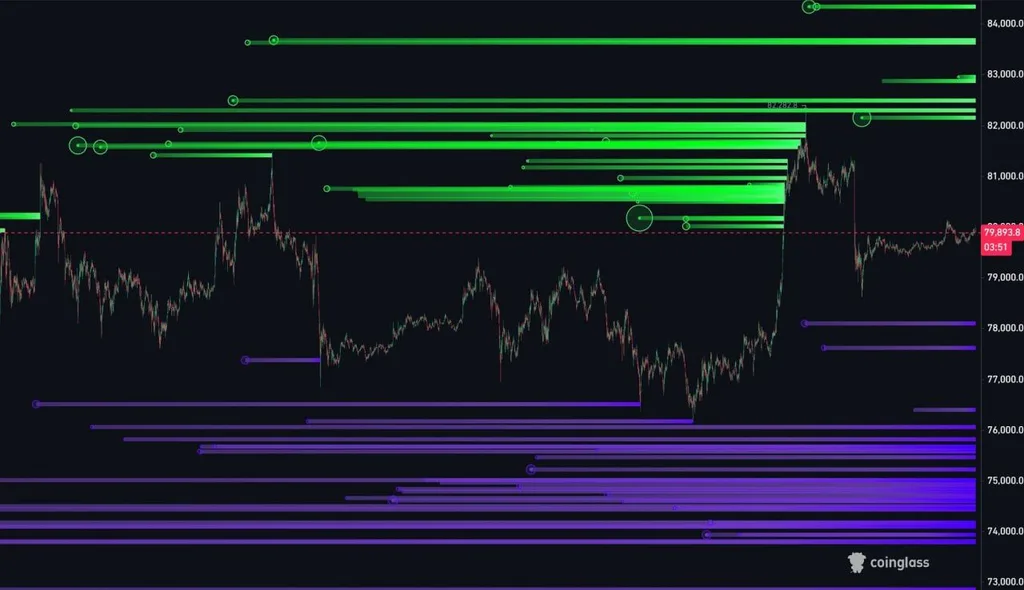
Bitcoin’s liquidity structure also shows significant concentrations above the current market, creating potential targets if $BTC can push through nearby resistance.
Bitcoin $BTC Liquidity Clusters. on X
The liquidation heatmap shows several dense liquidity bands between approximately $80,300 and $82,500, with additional concentrations closer to $83,000 and above $83,500. Bitcoin was positioned around $79,900 on the chart, leaving the closest substantial liquidity primarily overhead.
Those clusters do not guarantee that price will move higher, but they identify areas where leveraged positions could become vulnerable if momentum accelerates. A sustained push through $80,500 would therefore put the $81,000-$82,500 region into focus before Kaz’s broader $83,000-$84,000 objective.
Downside liquidity is also visible. Concentrations appear near $78,000 and $77,500, followed by a much larger group of levels between roughly $74,000 and $76,000.
That makes the $78,000-$78,500 region particularly important. Holding it would preserve the current recovery structure and provide a base for another attempt above $80,500. Losing it decisively would shift attention toward the lower liquidity clusters and invalidate the cleaner bullish continuation setup.
Bitcoin’s immediate direction therefore hinges on two boundaries: resistance around $80,500-$80,800 and support around $78,000-$78,500. A confirmed break above resistance would strengthen the path toward higher liquidity and $83,000-$84,000, while failure at resistance followed by a loss of support would favor a deeper retracement.
Source: cryptonews.net