

Close Menu
xpertsstudioxpertsstudio

    Subscribe to Updates

    Get the latest creative news from FooBar about art, design and business.

    What's Hot

    South Korea Confirms Crypto in Private Wallets and Overseas Exchanges Is Taxable

    August 20, 2026

    a new decentralized perpetuals exchange [Sponsored]

    August 20, 2026

    Acquisition Cost in Austria

    August 20, 2026
    Facebook Instagram YouTube WhatsApp TikTok Telegram
    xpertsstudioxpertsstudio
    Facebook Instagram YouTube WhatsApp TikTok Telegram
    • Home
    • DeFi News
    • Altcoin News
    • Bitcoin News
    • Ethereum News
    • Crypto Business
    • Crypto Markets
    • Crypto Regulation
    • More
      • Blockchain & Web3
    xpertsstudioxpertsstudio
    Home»Bitcoin News»Bitcoin Spot CVD Chart Analysis: Order Flow Insights for Aug. 18
    August 18, 20260 Views

    Bitcoin Spot CVD Chart Analysis: Order Flow Insights for Aug. 18

    EditorBy EditorAugust 18, 2026No Comments3 Mins Read
    Share Facebook Twitter Pinterest LinkedIn Tumblr Telegram Email Copy Link
    Follow Us
    Google News Flipboard
    Bitcoin Spot CVD Chart Analysis: Order Flow Insights for Aug. 18
    Share
    Facebook Twitter LinkedIn Pinterest Email

    Don't want to trade it yourself?

    Our desk runs DEX portfolios on profit share.

    35% Share
    $2.5K Minimum
    Learn more

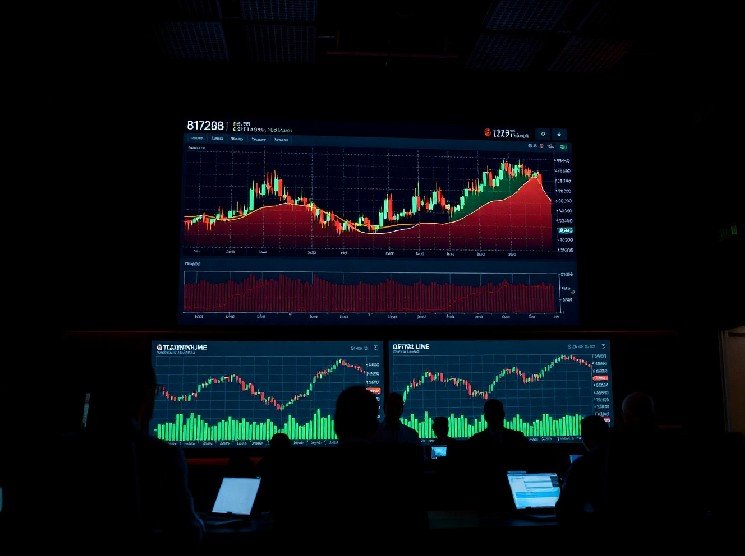
    On Aug. 18 at 9:00 a.m., the <a href="https://xpertsstudio.com/jane-street-reports-nearly-1b-bitcoin-etf-position-in-q2-2026/” title=”Jane Street Reports Nearly $1B Bitcoin ETF Position in Q2 2026″>Bitcoin spot market displayed notable order flow activity, as captured by the cumulative volume delta (CVD) chart for the BTC/USDT trading pair. The chart, which tracks the balance between aggressive buying and selling, offers traders a granular view of market pressure at specific price levels.

    Understanding the Spot CVD Chart

    The spot CVD chart is a tool used by traders to analyze order book dynamics. It consists of two primary components: the volume heatmap in the upper panel and the cumulative volume delta in the lower panel.

    The volume heatmap visualizes trading volume at each price level, with brighter colors indicating areas where the price lingered or moved sharply. These zones often act as support or resistance levels, as they represent clusters of historical activity where traders have previously shown interest.

    The lower panel’s CVD indicator reflects the net volume of buy and sell orders, segmented by order size. The yellow line tracks orders between $100 and $1,000, while the brown line represents large orders between $1 million and $10 million. When these lines rise, it indicates increasing buying pressure; when they fall, selling pressure dominates.

    What the Aug. 18 Data Shows

    At the 9:00 a.m. snapshot, the CVD lines for both retail-sized and large orders were moving in tandem, suggesting a broad alignment in market sentiment. The volume heatmap indicated a concentration of activity around the $29,500–$29,800 range, which could serve as a pivot area for the session.

    Large-order flow, often associated with institutional activity, showed a slight uptick, hinting at possible accumulation. However, the overall CVD remained below its recent highs, indicating that sellers have not been fully overwhelmed.

    Implications for Traders

    For traders, the CVD chart provides a real-time read on whether buyers or sellers are in control. The current data suggests a cautious market, with no clear directional bias. The identified support/resistance zones from the heatmap can be used to set stop-loss or take-profit levels.

    It’s important to note that CVD is a lagging indicator, and sudden news events can quickly alter the order flow. Traders should combine this analysis with other technical tools and fundamental news for a comprehensive view.

    Conclusion

    The Bitcoin spot CVD chart for Aug. 18 at 9:00 a.m. reflects a market in equilibrium, with neither buyers nor sellers dominating. The volume heatmap highlights key price levels to watch, while the CVD lines offer insight into the behavior of different order sizes. As always, order flow analysis is one piece of the puzzle, and prudent risk management remains essential.

    Q1: What is the spot CVD chart used for?
    The spot CVD chart is used to analyze the net buying and selling pressure in the spot market by tracking cumulative volume delta. It helps traders identify potential support and resistance levels and gauge market sentiment.

    Q2: How does the volume heatmap work?
    The volume heatmap displays trading volume at different price levels, with brighter colors indicating higher activity. These areas often act as support or resistance because they represent price levels where significant trading has occurred.

    Q3: What do the yellow and brown lines represent in the CVD indicator?
    The yellow line tracks orders between $100 and $1,000, representing retail-sized trades. The brown line tracks large orders between $1 million and $10 million, which are often associated with institutional activity. Rising lines indicate buying pressure, while falling lines indicate selling pressure.

    Source: cryptonews.net

    Partner offer

    Start trading on Bybit

    Deep derivatives liquidity, tight spreads, and a deposit bonus on your first funding.

    Claim bonus
    Analysis Bitcoin chart Order spot
    Share. Facebook Twitter Pinterest LinkedIn Tumblr Email
    K
    Mentioned in this article

    KuCoin

    Spot, futures and trading bots in one account. Our link applies a fee discount at signup.

    Open account

    Related Posts

    Bitcoin and ethereum prices today, Thursday, August 20, 2026: Crypto prices surge after President Trump pushes for Clarity Act

    August 20, 2026

    Coinbase CEO Says Crypto ‘On The Cusp’ Of Next Bull Market, Expects Trump Ethics Offer To Help Advance CLARITY Act

    August 20, 2026

    Coinbase Stock Surges Following White House Crypto Summit and Regulatory Push

    August 20, 2026
    Leave A Reply Cancel Reply

    Accepting new clients

    Portfolio Management

    Managed trading on centralised and decentralised markets, handled by our experienced trading desk.

    Professional crypto trading management
    Profit share 35%
    Min. capital $2,500
    Wallet Set up by us
    Execution Full service
    How the service works
    • New to on-chain trading? Our team runs it for you on a profit-sharing basis.
    • We create the wallet and place every trade — no DEX experience needed on your side.
    • The share is 35% of profit on each token traded.
    • Minimum starting capital is $2,500.
    Start DEX Management
    Profit share 00%
    Min. capital $0,000
    Custody Your account
    Execution Full service
    How the service works
    • Your funds remain in your own exchange account while our team manages the trading activity.
    • You maintain control of your account and funds throughout the management period.
    • We provide professional trading management based on the agreed strategy and terms.
    • Works with KuCoin, MEXC, Bybit and Phemex.
    • Receive a monthly report covering positions, trading activity and performance.
    CEX management terms, profit split and minimum capital are agreed in writing before onboarding.
    Apply for CEX Management

    Not financial advice. Crypto trading involves substantial risk and past results do not guarantee future returns. Capital can be lost in full. Full terms are agreed in writing before onboarding.

    Trusted Exchanges

    5

    Open an account through our partner links to claim fee discounts and sign-up bonuses.

    K KuCoin Spot & futures · trading fee discount M MEXC Widest altcoin listings · low maker fees B Blofin Copy trading · no-KYC onboarding Y Bybit Deep derivatives liquidity · deposit bonus P Phemex Contract trading · zero-fee spot plan

    Affiliate disclosure: we may earn a commission when you sign up through these links, at no extra cost to you. Trading carries risk — never invest more than you can afford to lose.

    Top Posts

    XRP Price to $0.18? Analysts Warn of Drop as Brad Garlinghouse Bets on Ripple’s Crypto Winter

    August 19, 20264 Views

    🚀 Best Crypto Exchange Liquidity Provider

    August 18, 20262 Views

    $50B Valuation and Buyback Explained

    August 20, 20261 Views
    0% Spot fees

    Phemex zero-fee spot plan

    Sign up with our referral code to activate the plan on a new account.

    CODE · E4G2K
    Redeem
    Most Popular

    XRP Price to $0.18? Analysts Warn of Drop as Brad Garlinghouse Bets on Ripple’s Crypto Winter

    August 19, 20264 Views

    🚀 Best Crypto Exchange Liquidity Provider

    August 18, 20262 Views

    $50B Valuation and Buyback Explained

    August 20, 20261 Views
    Our Picks

    South Korea Confirms Crypto in Private Wallets and Overseas Exchanges Is Taxable

    August 20, 2026

    a new decentralized perpetuals exchange [Sponsored]

    August 20, 2026

    Acquisition Cost in Austria

    August 20, 2026

    Stay Ahead of Crypto

    Get the latest crypto, blockchain, and Web3 news delivered straight to your inbox.

    Facebook Instagram YouTube WhatsApp TikTok Telegram
    • About Us
    • Contact us
    • Disclaimer
    • Privacy Policy
    • Terms & Conditions
    © 2026 Xperts Studio. All rights reserved.

    Type above and press Enter to search. Press Esc to cancel.