


Don't want to trade it yourself?
Our desk runs DEX portfolios on profit share.
Bitcoin’s Current Range Mirrors a Key 2023 Structure as $70K–$90K Levels Come Into Focus.
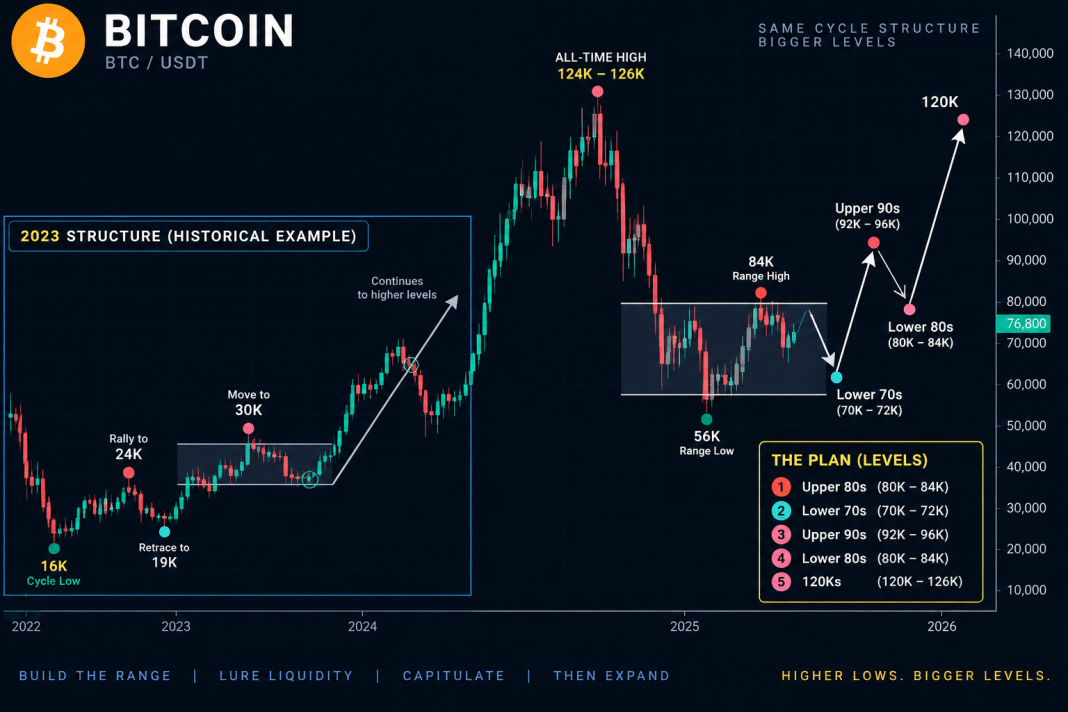
Bitcoin’s long-term chart shows a recurring sequence of rally, consolidation, downside liquidity sweep, and renewed expansion. The current structure is developing between roughly $60,000 and $84,000, following the decline from the chart’s major high near $124,000–$126,000.
The chart also highlights a 2023 structure as a historical comparison. The price levels and sequence are similar in form, although the present structure is occurring at substantially higher nominal $BTC prices.
Bitcoin’s 2023 Structure
The earlier section begins with Bitcoin bottoming around $16,000 following a prolonged decline. $BTC subsequently recovered to approximately $24,000, establishing the first major rebound from the cycle low.
Price then advanced toward roughly $30,000–$31,000, but that move did not immediately produce sustained continuation. $BTC moved back toward the mid-$20,000s before the larger advance developed.
The chart marks the sequence with colored reference points: a major low near $16,000, a higher reaction low around $18,000–$20,000, a rally toward $30,000, and another pullback into approximately $24,000–$25,000. The following expansion carried Bitcoin through $30,000 and eventually toward the $60,000–$70,000 region.
The Current Bitcoin Range
The right side shows a comparable price sequence at a larger scale.
After reaching approximately $124,000–$126,000, Bitcoin entered a steep decline. The first major downswing reached the mid-$60,000s, followed by a rebound toward approximately $80,000–$82,000.
$BTC then returned to the low-$60,000 region, with the deepest wick on the chart extending toward roughly $56,000. From that low, price recovered rapidly back into the upper-$70,000 area.
The latest candles are positioned around $76,000–$78,000.
$70K–$84K Defines the Immediate Structure
The chart identifies several levels around the current range. The low-$70,000 area sits below the current price and represents the next major zone inside the broader structure. Above price, approximately $84,000 forms the next marked level, followed by the mid-$90,000s.
The projected sequence displayed on the chart is:
Upper $80Ks → lower $70Ks → upper $90Ks → lower $80Ks → $120Ks.
These are projected levels shown by the chart, not completed price movements.
A move into the lower $70,000s would still remain well above the chart’s approximately $56,000 reaction low, meaning it would constitute a higher low relative to that wick.
A Range-High De
The 2023 comparison contains another notable feature: price moved above a local range before subsequently retracing.
Applied to the current structure, the equivalent sequence would involve $BTC first moving toward or through the $80,000–$84,000 range highs, followed by a return toward the lower part of the range.
From a liquidity-structure perspective, this would create price activity on both sides of the established range before a directional break.
Latest Five Candles Show Strong Rebound Followed by Compression
The five most recent candles show a sharp transition from selling to recovery.
The sequence begins around the $63,000–$65,000 region, followed by a large bullish expansion candle that pushes $BTC rapidly into approximately $77,000–$80,000. The next candles have considerably smaller real bodies around the upper-$70,000s.
Upper wicks near $80,000–$82,000 show that price has traded above the recent closes but has not maintained those intraperiod highs. At the same time, the latest bodies remain well above the previous $60,000–$65,000 consolidation.
This produces a clear short-term structure: strong rebound followed by price compression beneath the $80,000–$84,000 area.
Wyckoff Structure: Range Development After Markdown
The decline from approximately $124,000 to the $56,000–$64,000 region represents the chart’s markdown phase. The subsequent sideways movement between the low-$60,000s and low-$80,000s is consistent with a developing trading range.
Within Wyckoff terminology, the current structure is therefore closer to range development/testing following markdown than an established markup phase.
The chart does not display volume, so volume-based Wyckoff confirmation cannot be measured from this image.
The principal figures visible in the current structure are $56K–$64K for the established lower extreme, $70K–$72K as the highlighted higher-low region, $80K–$84K around the current upper range, the upper $90Ks as the next projected expansion area, and the $120K region as the final projected level shown on the chart.
Source: cryptonews.net
1 Comment
Pingback: PI Crypto Crashes – xpertsstudio