


Don't want to trade it yourself?
Our desk runs DEX portfolios on profit share.
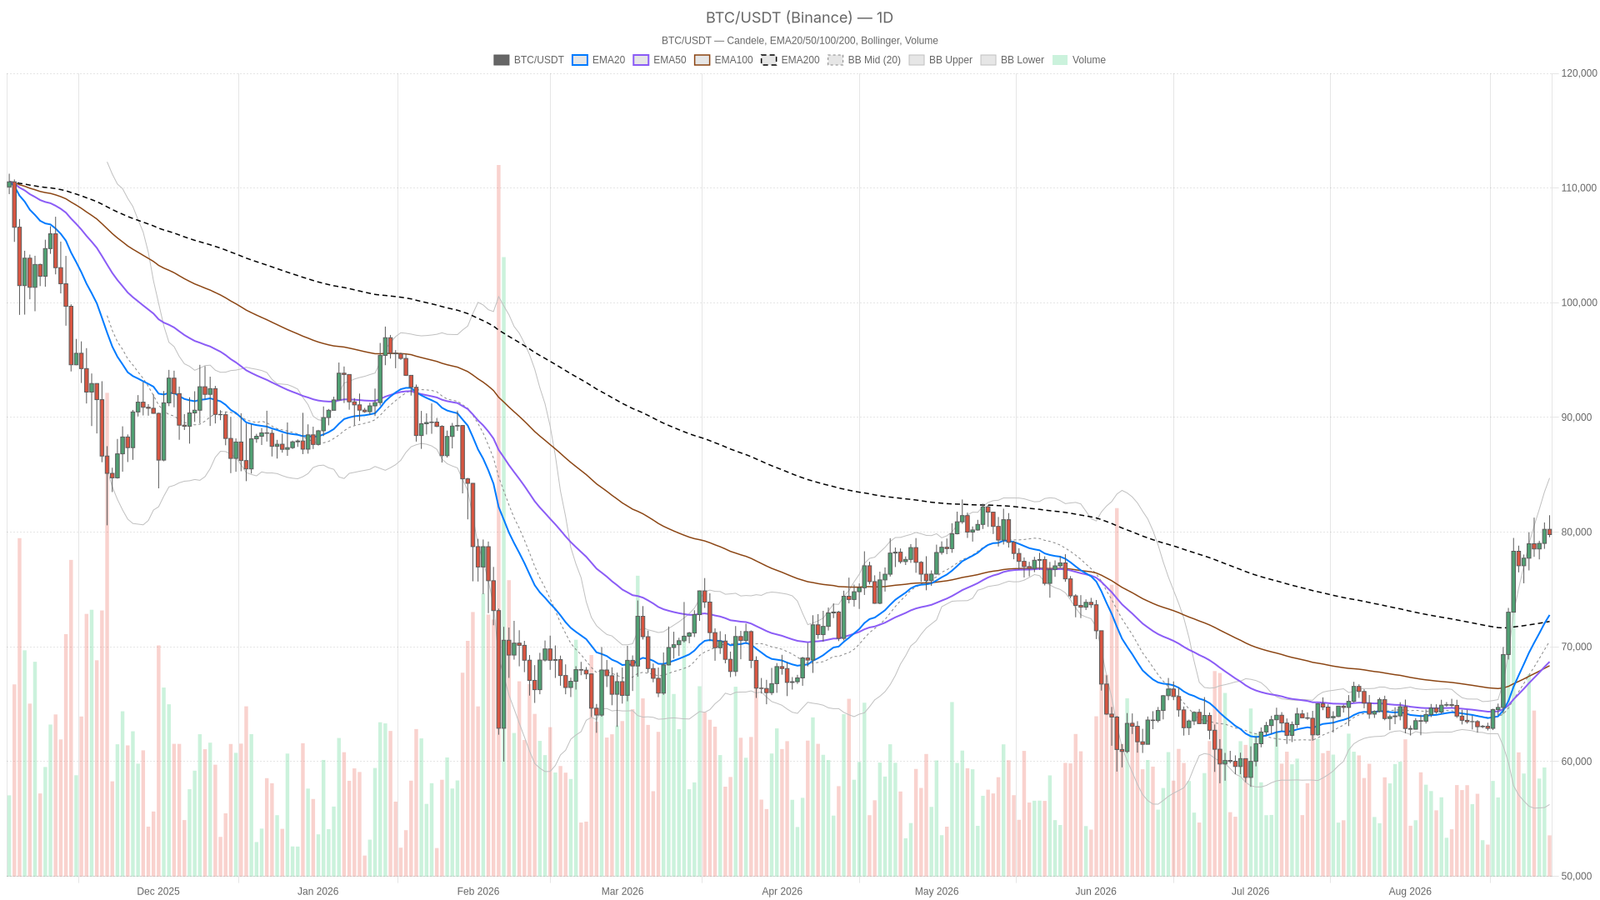
As of August 28, 2026, the Bitcoin price today sits at $79,789.69, just below the $80,000 mark. The daily chart shows strong momentum while shorter timeframes reveal early fatigue, creating a tense consolidation phase worth watching closely.
Key takeaways
- Bitcoin sits at $79,789.69 on August 28, 2026, just below the $80,000 level.
- The daily RSI14 reads 79.62, deep in overbought territory, while the daily MACD stays bullish.
- The hourly MACD has turned mildly negative, pointing to short-term momentum fatigue.
- The pivot at $80,275.56 marks the upside level, while $79,072.24 holds as key support.
- The Fear & Greed Index reads 73 (‘Greed’) even as total crypto market cap fell -1.81% in 24 hours.
Why This Consolidation Matters
This consolidation matters because Bitcoin’s surge past $80,000 was fast and headline-driven. Bloomberg reported Bitcoin surging past $80,000 on fresh US ETF inflows. Earlier, $BTC touched a three-month high as ‘momentum returns.’ CNBC flagged the move as the biggest 3-day rally since 2023. In other words, this is not a quiet grind. It is a rapid repricing, and rapid repricings tend to overshoot before they consolidate. That setup appears across the daily, hourly, and 15-minute charts.
Daily Chart: Bulls Are in Control, But the Tape Is Overheated
The daily chart shows bulls in control, but the tape is overheated. On the daily timeframe, the trend structure is unambiguous. Price at $79,789.69 trades well above the 20-day EMA at $72,784.37. It also sits above the 50-day EMA at $68,706 and the 200-day EMA at $72,215.59. That is a wide, expanding gap between spot and its moving averages. This kind of separation appears only during genuine trend acceleration, not routine drift.
The RSI14 backs that up loudly at 79.62, deep into overbought territory. In a healthy uptrend, RSI can stay elevated without triggering an immediate reversal. However, a reading this high warns that the move is stretched. It remains vulnerable to a sharp mean-reversion swing if buyers pause.
The MACD tells the same bullish story. The line at 4,228.89 sits well above the signal at 3,113.62, with a histogram of 1,115.28. It is wide and positive, meaning momentum is still accelerating rather than rolling over. No bearish crossover has appeared on this timeframe yet.
Bollinger Bands show the mid-line at $70,491.57. The upper band sits at $84,723.77 and the lower band at $56,259.36. Price is closer to the upper band but has not tagged it. That means there is still room to run before the daily chart hits a hard ceiling. The ATR14 at 2,719.13 confirms volatility has expanded meaningfully. Swings of a few thousand dollars are now the norm, so shallow pullbacks should not be read as trend failure.
The daily pivot structure adds nuance. The pivot point sits at $80,275.56, with R1 at $80,993 and S1 at $79,072.24. Spot price is currently just below the pivot. That puts the market in a slightly defensive posture relative to the classic pivot framework. Bulls need to reclaim $80,275.56 to fully re-assert control. Meanwhile, $79,072.24 is the line that keeps the broader uptrend intact.
Hourly Timeframe: Momentum Cools After the Vertical Move
The hourly chart shows momentum cooling after the vertical move. Zooming into the 1H chart, the picture shifts from acceleration to consolidation. Price trades between the 20-hour EMA at $79,855.85 above and the 50-hour EMA at $79,501.81 below. This is a classic pinch after a sharp rally. The 200-hour EMA at $76,515.43 remains far below, confirming the broader trend has not broken.
RSI14 on the hourly has cooled to a neutral 50.29. It has essentially wiped out the extreme reading seen on the daily. That is normal after a fast move. It simply means there is no directional edge on this timeframe alone right now.
The hourly MACD has actually flipped negative. The line at 107.2 sits below the signal at 210.31, with a histogram of -103.11. That is a mild bearish crossover, and it lines up with the Bollinger Bands. The mid-line sits at $80,062.32, with price trading below it and closer to the lower band at $79,453.21. Momentum has stalled, not reversed, but it has stalled.
ATR14 on the hourly is a modest 397.03, a fraction of the daily reading. That reinforces a period of digestion rather than distribution. The hourly pivot has PP at $79,763.23, R1 at $79,866.46, and S1 at $79,686.45. Price sits just above the pivot, boxed into a tight range while the market waits for the next catalyst.
15-Minute View: Early Signs of Stabilization
The 15-minute chart shows early signs of stabilization. This is where execution context lives. It shows the first tentative signs of a bounce attempt. Price sits below the 20-period EMA at $79,817.87 and the 50-period EMA at $79,929.4. However, it remains above the 200-period EMA at $79,635.79. That is a minor pullback sitting inside a larger sideways band.
RSI14 at 47.35 is soft but not broken. More interesting is the MACD. The line at -93.84 remains below the signal at -106.12, so no confirmed bullish cross has appeared. Still, the histogram has flipped positive at +12.29. That is often the earliest tell of a short-term reversal attempt. It is not confirmation, but it is worth watching.
Bollinger Bands are tight here. The mid-line sits at $79,762.42, the upper band at $79,943.77, and the lower band at $79,581.07. The ATR14 of 158.64 confirms volatility has compressed sharply. The 15-minute pivot point sits at $79,788, essentially where price trades right now. This is a coiled market, not a trending one, on the smallest timeframe.
Bullish and Bearish Scenarios
Two scenarios matter: a bullish reclaim above $80,275.56 or a bearish break below $79,072.24. The bullish path requires $BTC to reclaim the daily pivot at $80,275.56 and push through R1 at $80,993. The hourly chart must flip back above its 20-EMA at $79,855.85. Moreover, the 15-minute MACD’s early positive tick must turn into a real breakout above the $79,943.77 upper band.
If that happens, the daily upper Bollinger Band near $84,723.77 becomes the next realistic target. Traders still cite ETF-driven demand as the fundamental driver behind the move past $80,000. What would kill this scenario is a failure to reclaim $80,275.56. Combined with a negative hourly MACD and a loss of the $79,501.81 EMA50 support, that would flip the near-term structure defensive fast.
The bearish scenario centers on the stretched daily RSI. A break below the daily S1 at $79,072.24 would be the first real technical crack. Given RSI14 at 79.62, that setup is exactly where profit-taking can accelerate into a sharper mean-reversion move. Price could fall back toward the daily 20-EMA at $72,784.37 or the Bollinger mid-line near $70,491.57.
This scenario gains credibility from the broader market backdrop. Total crypto market cap slipped -1.81% over 24 hours even as $BTC dominance held near 59.24%. That combination sometimes signals capital leaving the market broadly rather than just rotating out of altcoins. What would invalidate the bearish case is a reclaim of the hourly EMA20 at $79,855.85. If the 15-minute chart also clears $79,943.77 on real volume, the path back toward $80,275 returns to the table.
Positioning, Risk, and What This Moment Really Tells Us
This moment signals a decision zone, not a broken uptrend. The Fear & Greed Index reading of 73 (‘Greed’) shows sentiment has not caught up with the hourly chart’s hesitation. Traders are still leaning bullish even as lower-timeframe momentum cools. That divergence deserves respect rather than dismissal. Total market capitalization sits around $2.697 trillion and fell -1.81% over the past day, according to CoinGecko. Meanwhile, $BTC dominance remains elevated, suggesting Bitcoin is the more resilient asset within a broader market that is leaking value elsewhere.
None of this makes the next move obvious. The daily structure says the trend is intact and accelerating. The hourly says momentum has paused and mildly reversed. The 15-minute chart says the market is coiled and waiting. When timeframes disagree like this, the honest read is that $BTC is in a decision zone. It is not because the uptrend is broken, but because it has stretched far enough that a pause was overdue.
Volatility, as measured by the daily ATR of 2,719.13, is elevated enough that moves in either direction could be sharp. Anyone tracking the Bitcoin price today should treat the $80,275 pivot on the upside and the $79,072 support on the downside as the two levels most likely to decide which scenario plays out first. Both directions currently carry real conviction behind them.
In short, Bitcoin is holding just below $80,000 in a high-volatility decision zone. The daily chart remains bullish but overheated, while the hourly and 15-minute charts point to a pause. The $80,275.56 pivot and the $79,072.24 support are the key levels to watch next.
Is Bitcoin overbought right now?
Yes, the daily RSI14 reads 79.62, which is deep in overbought territory. That said, RSI can stay elevated in a healthy uptrend. The reading signals that the move is stretched and vulnerable to a sharp mean-reversion swing if buyers pause.
What are the key levels to watch for Bitcoin?
The daily pivot at $80,275.56 is the key upside level, with R1 at $80,993. On the downside, support sits at $79,072.24. A break below that level would be the first real technical crack, potentially opening a move toward the daily 20-EMA at $72,784.37.
Why has Bitcoin stalled near $80,000?
The daily chart shows a strong uptrend, but the hourly MACD has turned mildly negative and hourly RSI has cooled to 50.29. After a fast, headline-driven repricing past $80,000, the lower timeframes are showing momentum fatigue while the broader trend remains intact.
Disclaimer: This article is for informational purposes only and does not constitute financial advice, an investment recommendation, or a solicitation to buy or sell any financial instrument or cryptocurrency. The analysis provided is not indicative of future results. Investing in crypto assets and financial markets carries a high risk of capital loss. Always do your own research (DYOR) and consult a qualified financial advisor before making any decision.
Article produced with the assistance of artificial intelligence and reviewed by the editorial team.
Source: cryptonews.net