


Don't want to trade it yourself?
Our desk runs DEX portfolios on profit share.
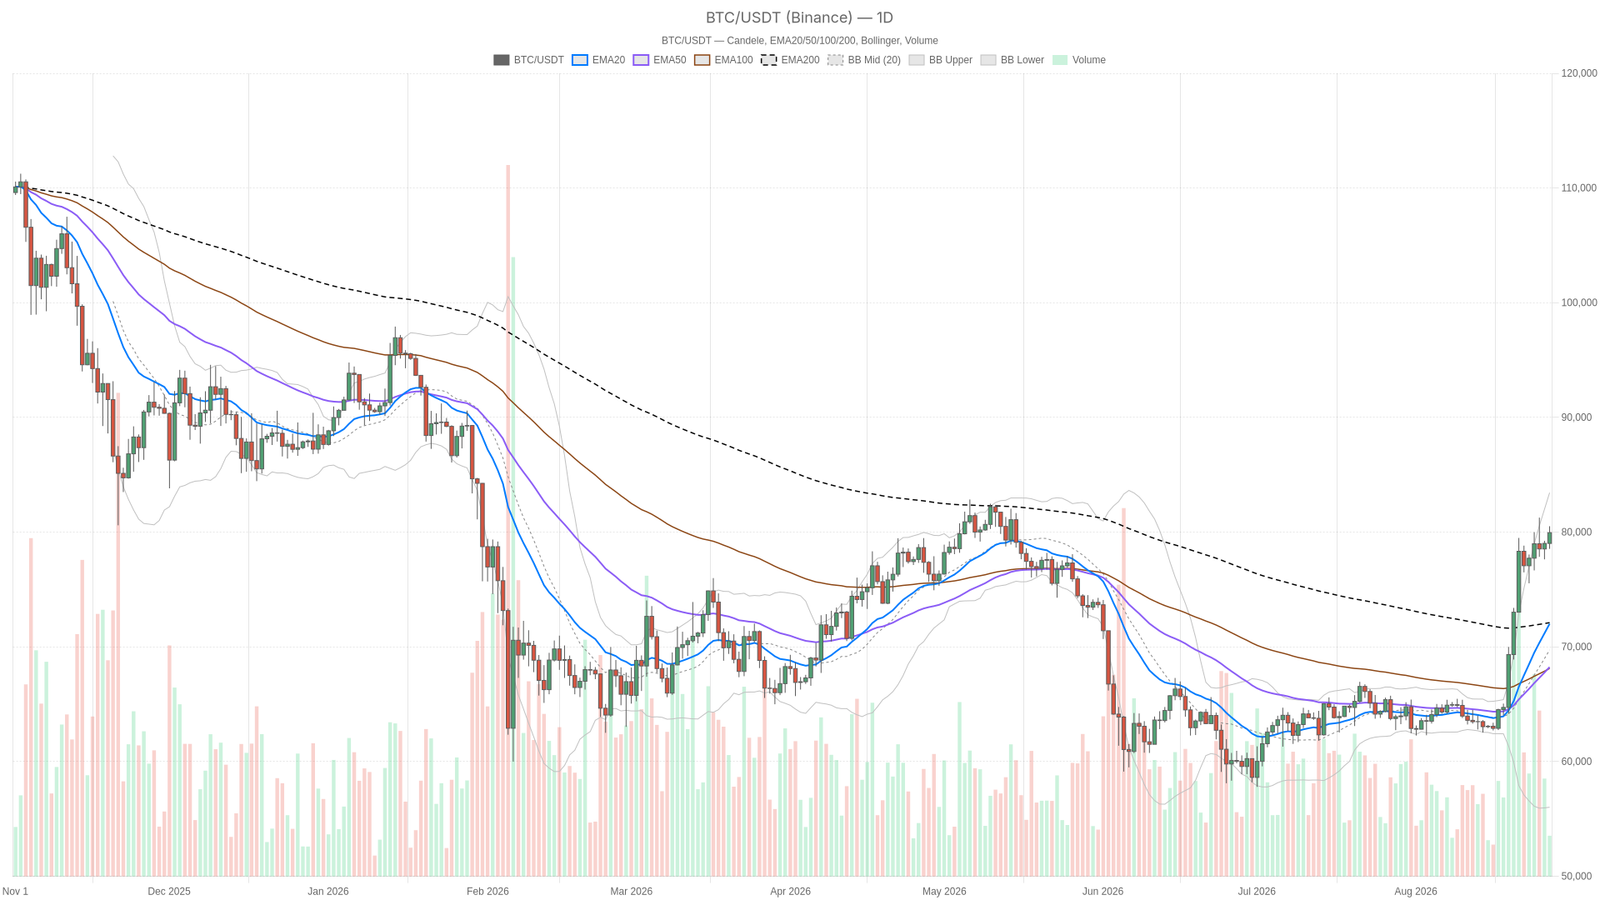
As of August 27, 2026, Bitcoin price today sits at $79,960, just below the $80,000 level it broke earlier this week for the first time in three months.
Key takeaways
- Bitcoin traded at $79,960 on August 27, 2026, just below the $80,000 level it first broke in three months earlier that week.
- The daily RSI14 read 81.71, deep in overbought territory, while the MACD histogram stayed positive at 1288.02.
- Daily pivots placed R1 resistance at $80,804.66 and S1 support at $78,830.79.
- Total crypto market cap sat near $2.70 trillion, with Bitcoin dominance near 59.2% and the Fear & Greed Index at 71.
Market logic: trend strength meets overbought risk
On the daily timeframe, $BTC traded at $79,960 against an EMA20 of $72,019, an EMA50 of $68,242, and an EMA200 of $72,114. That is a textbook bullish stack, with price above all three averages. This confirms the uptrend that has been building since the squeeze Fortune reported in late August. A Treasury buyback move reportedly blew up shorts positioned for $BTC to stay below $67,000. That short-covering event appears to have been the spark, while ETF-driven follow-through has been the fuel.
The daily RSI14, however, read 81.71. That is deep into overbought territory by any conventional standard, and it shows a market that has moved fast and far in a short window. The daily MACD backs the bullish momentum story. The MACD line at 4118.2 sits well above the signal line at 2830.18, with a histogram of 1288.02 confirming that upward momentum is still expanding rather than fading.
Yet when RSI and price extension run this hot at the same time, the market usually needs a sideways pause or a sharp pullback to reset. Interestingly, the system’s own regime read for the daily timeframe comes back as neutral despite this bullish stack. That is a reminder that trend direction and overbought risk are not the same thing.
What the Bollinger Bands and ATR say about room to move
The daily Bollinger Bands show a mid-line of $69,735.74, an upper band of $83,446.32, and a lower band of $56,025.15. Price at $79,960 is closing in on that upper band but has not tagged it yet. There is roughly $3,500 of daily-chart room before $BTC would press against the statistical ceiling of its own volatility envelope. That gap matters because it means the rally is not fully extended by this measure, even though RSI says otherwise.
The daily ATR14 of $2,635.75 confirms a genuinely volatile tape rather than a slow drift. Moves of that size in a single session are becoming the norm, which raises the stakes for anyone sizing positions off outdated volatility assumptions.
Daily pivot levels put the pivot point at $79,675.39, with resistance at R1 of $80,804.66 and support at S1 of $78,830.79. Price is currently hovering just above the pivot, which makes the $80,800 zone the next real test. A clean break there would put the market in genuine price-discovery territory relative to the recent three-month range.
Lower timeframes: momentum confirms but is losing steam
The 1H chart shows a bullish regime read, with price at $79,968 above the EMA20 at $79,046.21, the EMA50 at $78,822.60, and the EMA200 at $75,654.54. RSI14 on the 1H sits at 68.15, still firm but notably cooler than the daily’s 81.71. The MACD histogram on the 1H is positive at 158.29, confirming intact intraday momentum. However, the line-to-signal gap of 259.65 versus 101.36 is narrower than what you would want for a hard acceleration.
On the 15-minute chart, the picture softens further. RSI14 reads 63.61, the MACD histogram shrinks to 61.13, and price is essentially glued to its own pivot point of $79,958.97 against a close of $79,970.15. This is the tell that matters for execution.
The daily trend is still up, and the 1H still confirms it, but the 15m tape shows momentum decelerating into a tight, indecisive range right at resistance. That is not a reversal signal by itself, yet it is the kind of coiling that typically resolves with a decisive move rather than a slow grind.
Bullish and bearish scenarios
The bullish case is straightforward. The daily uptrend, backed by real ETF inflow data and a market that just blew through $80,000 for the first time in three months, has structural support from the EMA20/50/200 stack and an expanding MACD. A clean daily close above the $80,804.66 R1 pivot, with 1H RSI holding above 60, would suggest the rally still has legs.
In that case, the overbought RSI reading is simply a symptom of a strong trending market rather than an imminent reversal. This scenario would be invalidated if price fails repeatedly at R1 while 15m momentum keeps fading.
The bearish, or more accurately corrective, case rests on the daily RSI at 81.71 mean-reverting, a common outcome after such extreme readings. A drop back toward the daily EMA20 near $72,019, or at minimum a retest of the S1 pivot at $78,830.79, would be a normal and healthy pullback within an intact uptrend. That reading would only turn genuinely bearish if $BTC lost the daily EMA50 at $68,242 with confirming volume and momentum. Until then, dips are corrective rather than structural.
Positioning and risk going forward
Going forward, the $80,800 resistance and the $78,830 support will likely frame the next move. Broader market context adds another layer worth weighing. Total crypto market cap sits at roughly $2.70 trillion, down 0.47% over 24 hours, while Bitcoin’s dominance holds near 59.2%. That combination suggests capital is not broadly fleeing crypto, although altcoins may be lagging Bitcoin’s specific strength.
The Fear & Greed Index reads 71, squarely in Greed territory. This lines up with the daily RSI reading and reinforces the idea that sentiment has run ahead of itself even if the underlying trend remains constructive.
None of this resolves the core tension cleanly. Bitcoin price today reflects a market with strong trend evidence on the daily and 1H charts, cooling momentum on the 15m, and a daily RSI that is historically associated with pauses or pullbacks rather than fresh breakouts. Volatility is elevated, as the ATR readings confirm, and that cuts both ways.
Moves can extend further than expected, but reversals tend to be sharp rather than gradual. Anyone tracking this setup should treat the $80,800 daily resistance and the $78,830 support as the two levels likely to define whether this rally extends or takes a breather.
What was Bitcoin’s price on August 27, 2026?
Bitcoin traded at $79,960 on the daily chart, just below the $80,000 mark it first broke in three months earlier that week.
Why is the daily RSI a concern even though the trend is bullish?
The daily RSI14 read 81.71, deep in overbought territory, while price sat above the EMA20, EMA50, and EMA200. That tension suggests a pause or pullback could follow, even without a trend change.
What levels should traders watch next?
The key levels are R1 resistance at $80,804.66 and S1 support at $78,830.79, with the daily EMA20 near $72,019 as a deeper reference.
Disclaimer: This article is for informational purposes only and does not constitute financial advice, an investment recommendation, or a solicitation to buy or sell any financial instrument or cryptocurrency. The analysis provided is not indicative of future results. Investing in crypto assets and financial markets carries a high risk of capital loss. Always do your own research (DYOR) and consult a qualified financial advisor before making any decision.
Article produced with the assistance of artificial intelligence and reviewed by the editorial team.
Source: cryptonews.net
1 Comment
Pingback: Cardano Crypto Achieves 6x Throughput Boost With Leios Testnet, Here’s Impact on ADA Price – xpertsstudio