


Don't want to trade it yourself?
Our desk runs DEX portfolios on profit share.
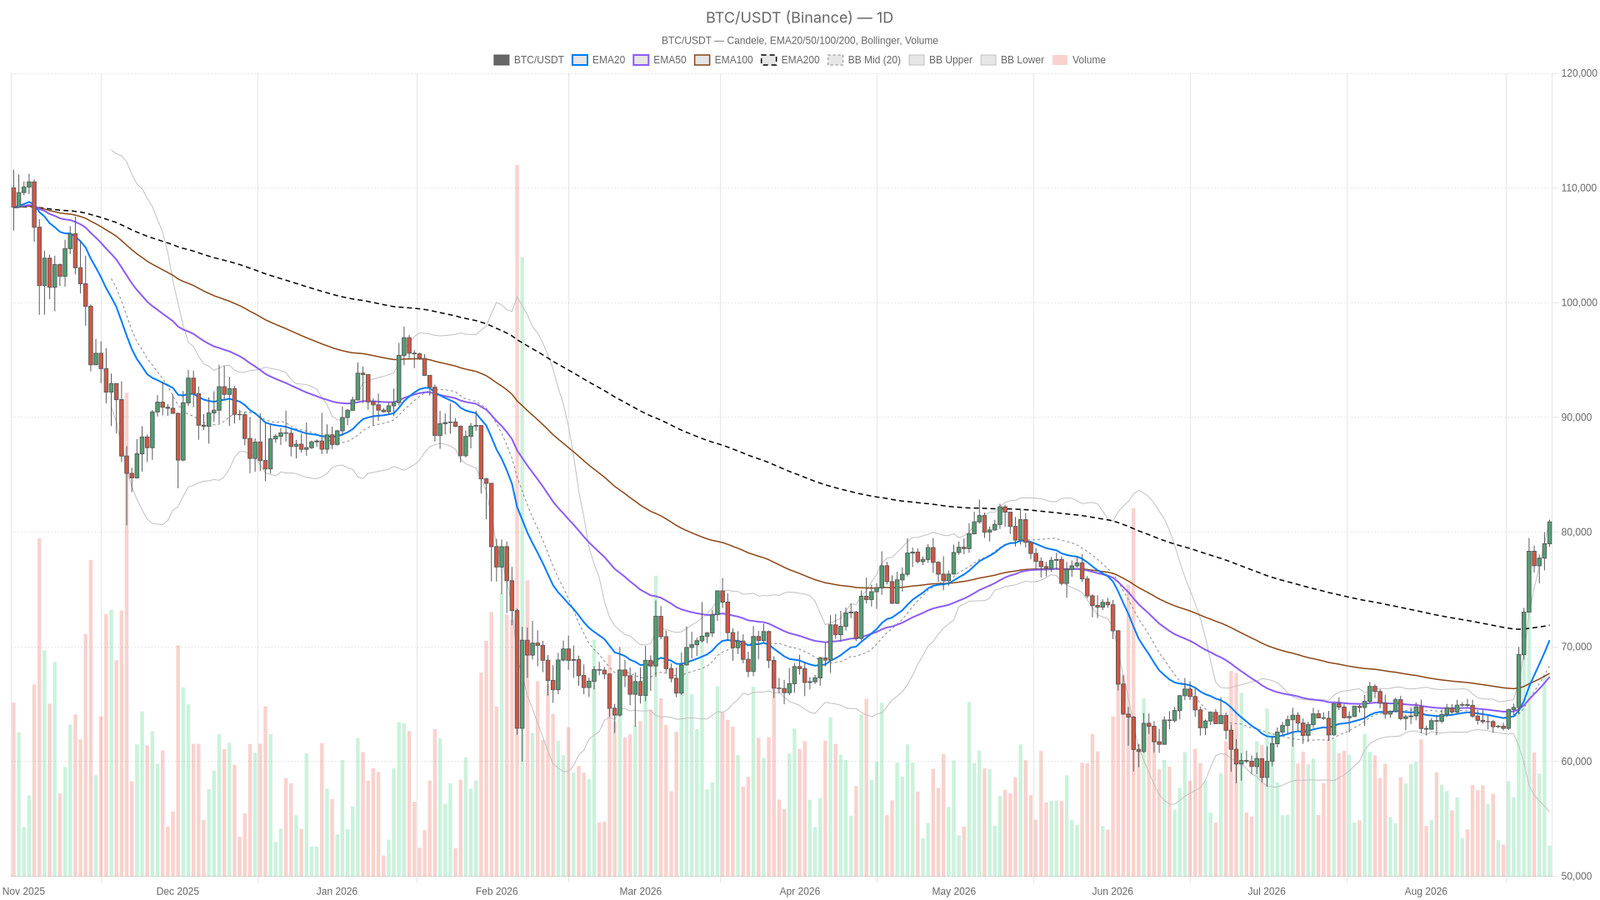
As of August 25, 2026, the Bitcoin price is trading at $80,894 on the daily chart, sitting just below the upper Bollinger Band and pushing into territory not visited previously this cycle. The move caps what CNBC described as crypto’s biggest three-day rally since 2023.
Key takeaways
- Bitcoin trades at $80,894 with daily RSI at 84.01, deep in overbought territory.
- Total crypto market cap reached $2.73 trillion, with $BTC dominance holding at 59.29% according to CoinGecko.
- The rally was triggered by a Treasury-related buyback event that forced a massive short squeeze on traders positioned below $67,000.
- The Fear & Greed Index sits at 74, signaling greed-driven momentum rather than cautious accumulation.
- A daily close above 81,103 would confirm continuation; a break below the pivot at 80,233 would signal exhaustion.
Daily chart: overbought, but nobody is selling
The daily chart shows an extremely overbought Bitcoin at RSI 84.01, yet momentum continues to accelerate rather than fade, which is why sellers remain sidelined despite the stretched reading. Price at $80,894 is trading well above the 20-EMA (70,582), the 50-EMA (67,397) and the 200-EMA (71,899), forming a fully bullish stack that confirms the macro trend has turned decisively upward after months of chop.
However, the price is pressing right against the upper Bollinger Band at 81,103, with the mid-band all the way down at 68,367. That gap between price and the mean is unusually wide, the kind of stretch that normally invites a pullback or at least a pause. The MACD tells the same story from a different angle: the line at 3,898.68 sits far above the signal at 2,192.19, with a rising histogram of 1,706.49. Interestingly, the system still tags the daily regime as neutral, a reminder that trend-strength models can lag reality when a move is this fast. Meanwhile, the daily ATR of 2,475.56 confirms volatility has expanded meaningfully, so swings in both directions should be expected even within an uptrend. The daily pivot at 80,233 with resistance at 81,751 and support at 79,377 frames the immediate battleground: as long as price holds above the pivot, buyers keep control of the session.
1H and 15m: confirmation, not divergence
Lower timeframe charts confirm the bullish structure without generating bearish divergence signals, which supports the daily trend rather than fighting it. On the 1H chart, price at 80,878 sits above all three EMAs (78,919 / 78,016 / 73,207) in a clean bullish regime, with RSI at 73.43, hot but not as stretched as the daily. The MACD histogram is positive at 137.83 and the line remains above the signal, so the hourly trend is still pushing.
Notably, the 1H Bollinger upper band at 80,562 has already been tagged, and price is now trading slightly above it, a sign of a strong impulsive leg rather than a band-bound range. The 15-minute chart reinforces the same picture: EMA20 (79,607) above EMA50 (79,131) above EMA200 (78,179), RSI at 76.39, and a MACD histogram of 179.99 that is still expanding. When all three timeframes point the same direction, the trade is with the trend; the only argument against chasing it here is how extended the daily RSI already is.
What is actually driving this Bitcoin price move
A Treasury-related buyback event triggered a massive short squeeze, catching traders who had been positioned for Bitcoin to stay below $67,000. Fortune reported that this positioning unwind blew up in a single afternoon, a classic squeeze dynamic that explains why momentum accelerated so hard rather than building gradually. That kind of forced unwind tends to overshoot on the way up, which lines up neatly with the daily RSI extreme.
Sentiment data backs this up: the Fear & Greed Index sits at 74, firmly in greed territory, meaning retail and momentum-driven flow are now fully engaged rather than cautious. Moreover, on-chain activity elsewhere in crypto is also picking up, with DEX fee volumes on platforms like Uniswap V3 and Curve surging double- and triple-digit percentages over the past week, a signal that risk appetite is broadening beyond just $BTC spot buying.
Bullish and bearish scenarios
The bullish path remains intact as long as the Bitcoin price holds above the daily pivot at 80,233 and the 1H EMA20 near 78,919. The path of least resistance stays up, with the next real test being a clean daily close above the upper Bollinger Band at 81,103. A break and hold above the daily R1 at 81,751 would confirm continuation and likely draw in more momentum buyers. This scenario would be invalidated by a daily close back below the 80,233 pivot, which would signal the squeeze-driven leg has exhausted.
Conversely, the bearish case rests entirely on the overbought daily RSI and the extreme distance from the mean. A rejection at the upper Bollinger Band, combined with a rollover in the 1H MACD histogram, would be the first warning sign of a pullback. A trader watching the tape closely could catch this before it shows up on the daily. That case gets invalidated the moment price reclaims and holds above 81,751 with the 1H histogram still expanding, since that would confirm buyers are absorbing the overbought condition rather than being trapped by it.
Positioning into this kind of tape
This is a market where trend and stretch are pulling in opposite directions, and both readings are legitimate. The EMA structure across all three timeframes says the trend is bullish and intact; the RSI and Bollinger Band extension say this particular leg is due for at least a pause. Ultimately, the daily ATR near 2,476 and the sharp 1H/15m volatility expansion mean whatever happens next likely happens fast, not slowly. Treat the pivot and EMA20 levels on each timeframe as the practical lines in the sand, size for the volatility that is clearly present, and do not assume the greed reading of 74 guarantees the rally continues in a straight line. Squeezes that move this fast tend to leave air pockets on the way down just as easily as they build momentum on the way up.
What is driving the current Bitcoin price surge?
A Treasury-related buyback event triggered a massive short squeeze, forcing traders who had been positioned for Bitcoin to stay below $67,000 to unwind rapidly. This created an overshoot that pushed the Bitcoin price to $80,894 with daily RSI reaching 84.01.
Is Bitcoin overbought right now?
Yes, the daily RSI at 84.01 is firmly in overbought territory, and the price is pressing against the upper Bollinger Band at 81,103. However, MACD momentum is still accelerating, which explains why the trend has not reversed despite the stretched reading.
What are the key levels to watch for Bitcoin’s next move?
The daily pivot at 80,233 is the critical line in the sand. Resistance sits at 81,751, and a clean break above that level with expanding momentum would confirm continuation. On the downside, support at 79,377 needs to hold to prevent a deeper pullback toward the mid-band at 68,367.
Disclaimer: This article is for informational purposes only and does not constitute financial advice, an investment recommendation, or a solicitation to buy or sell any financial instrument or cryptocurrency. The analysis provided is not indicative of future results. Investing in crypto assets and financial markets carries a high risk of capital loss. Always do your own research (DYOR) and consult a qualified financial advisor before making any decision.
Article produced with the assistance of artificial intelligence and reviewed by the editorial team.
Source: cryptonews.net