


Don't want to trade it yourself?
Our desk runs DEX portfolios on profit share.
-
Sell the BTC/USD pair and set a take-profit at 72,000.
-
Add a stop-loss at 80,000.
-
Timeline: 1-2 days.
-
Buy the BTC/USD pair and set a take-profit at 80,000.
-
Add a stop-loss at 72,000.
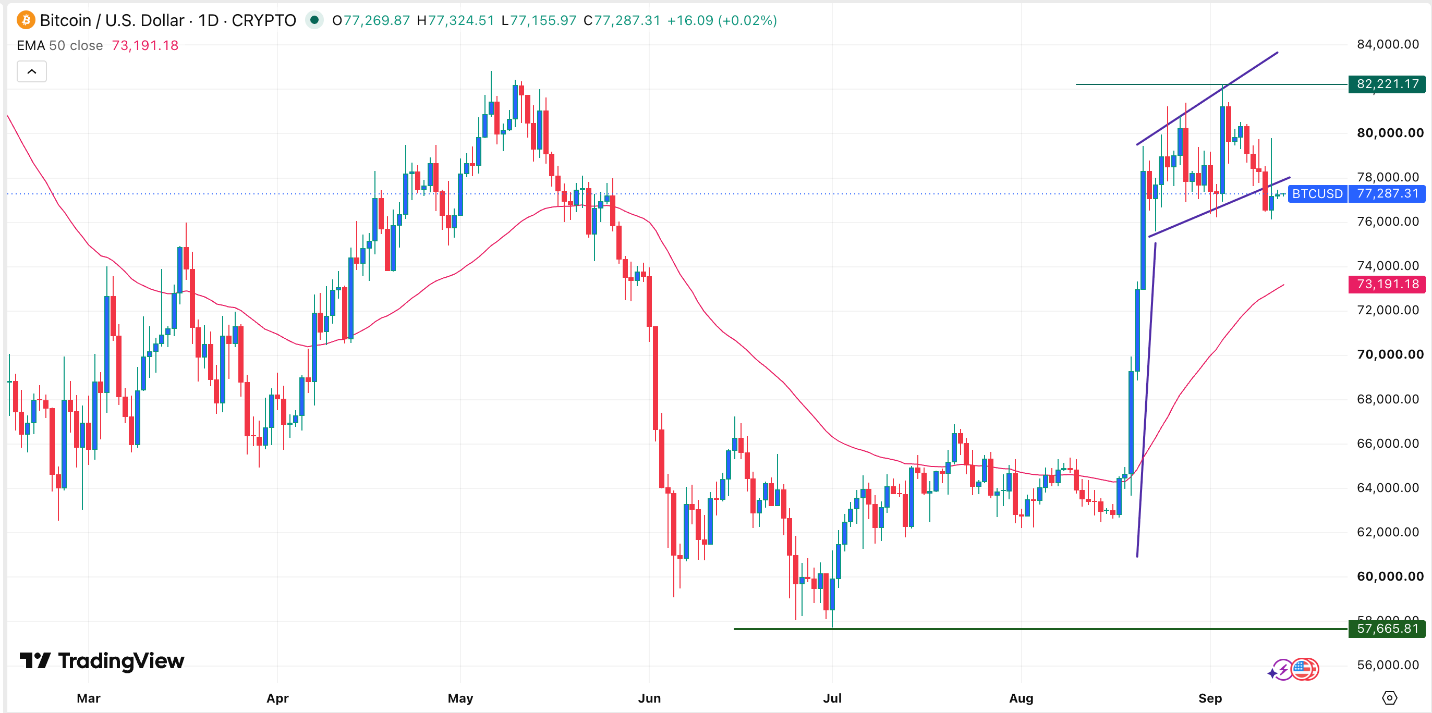
Bitcoin price remained under pressure on Monday as investors adjusted to the rising oil prices, ETF outflows, and the upcoming Federal Reserve interest rate decision. The BTC/USD pair was trading at 77,230, a few points below last month’s high of 82,000.
1
Get Started74% of retail CFD accounts lose moneyRead Review
Bitcoin Price Pressured as Risks Rise
There are signs that risks are rising, which is seen by the performance of Bitcoin ETFs. Data shows that these funds had outflows in the last four consecutive days. They shed over $13.2 million on Friday after losing $282 million on Thursday. In total, these funds shed over $462 million last week.
One of the risks is that oil prices have continued rising this month, with Brent and the West Texas Intermediate (WTI) moving above $100 a barrel. The two benchmarks have jumped by double digits from the lowest level in August this year.
Oil prices will continue rising now that Saudi Arabia has closed the East-West pipeline that has been moving over 7 million barrels per day. Higher oil prices will lead to a steady inflation in the US. The most recent data showed that the headline and core inflation remained above the Fed’s target of 2.0%.
Therefore, there is a risk that the Federal Reserve will hike interest rates this week. Polymarket places odds of a hike at over 90%. The same is true with the CME FedWatch tool. Bitcoin and other cryptocurrencies normally underperform the market whenever the Fed is hiking rates.
Another risk is that the US bond market is cracking, with yields continuing their upward trend. The ten-year yield has jumped to 5%, the highest level in years as the US public debt has jumped to over $40 trillion.
BTC/USD Technical Analysis
The daily chart shows that the BTC/USD pair has pulled back in the past few weeks, moving from a high of 82,221 on September 3 to the current 77,262. It has moved slightly below the lower side of the ascending channel.
The pair has remained above the 50-day Exponential Moving Average (EMA) and the Supertrend indicator. It has formed a bullish flag pattern, which often leads to more gains over time.
Therefore, the most likely scenario is where it continues falling, potentially to 74,000, ahead of the FOMC decision. The alternative scenario is where it rebounds, potentially to 80,000.
Ready to trade our daily Forex signals? Here’s a list of some of the best crypto brokers to check out
Source: www.dailyforex.com