



Don't want to trade it yourself?
Our desk runs DEX portfolios on profit share.
Key Insights
- Bitcoin price climbed near $70,000 after breaking above its recent trading range.
- U.S. government debt crossed $40 trillion as Treasury expanded long-term bond buybacks.
- U.S. spot Bitcoin ETFs attracted $517 million on Aug. 19, extending a three-day inflow streak.
Bitcoin price traded near $70,000 after breaking above its recent consolidation range. BTC reached almost $69,994 overnight, its highest level in roughly 11 weeks.
The move came as Treasury yields retreated, U.S. spot Bitcoin ETF inflows accelerated, and Washington signaled continued support for crypto legislation.
Bitcoin also remained well above its 2026 low near $57,650, strengthening the short-term recovery structure.
Bitcoin Price May Benefit as US Debt Crosses $40 Trillion
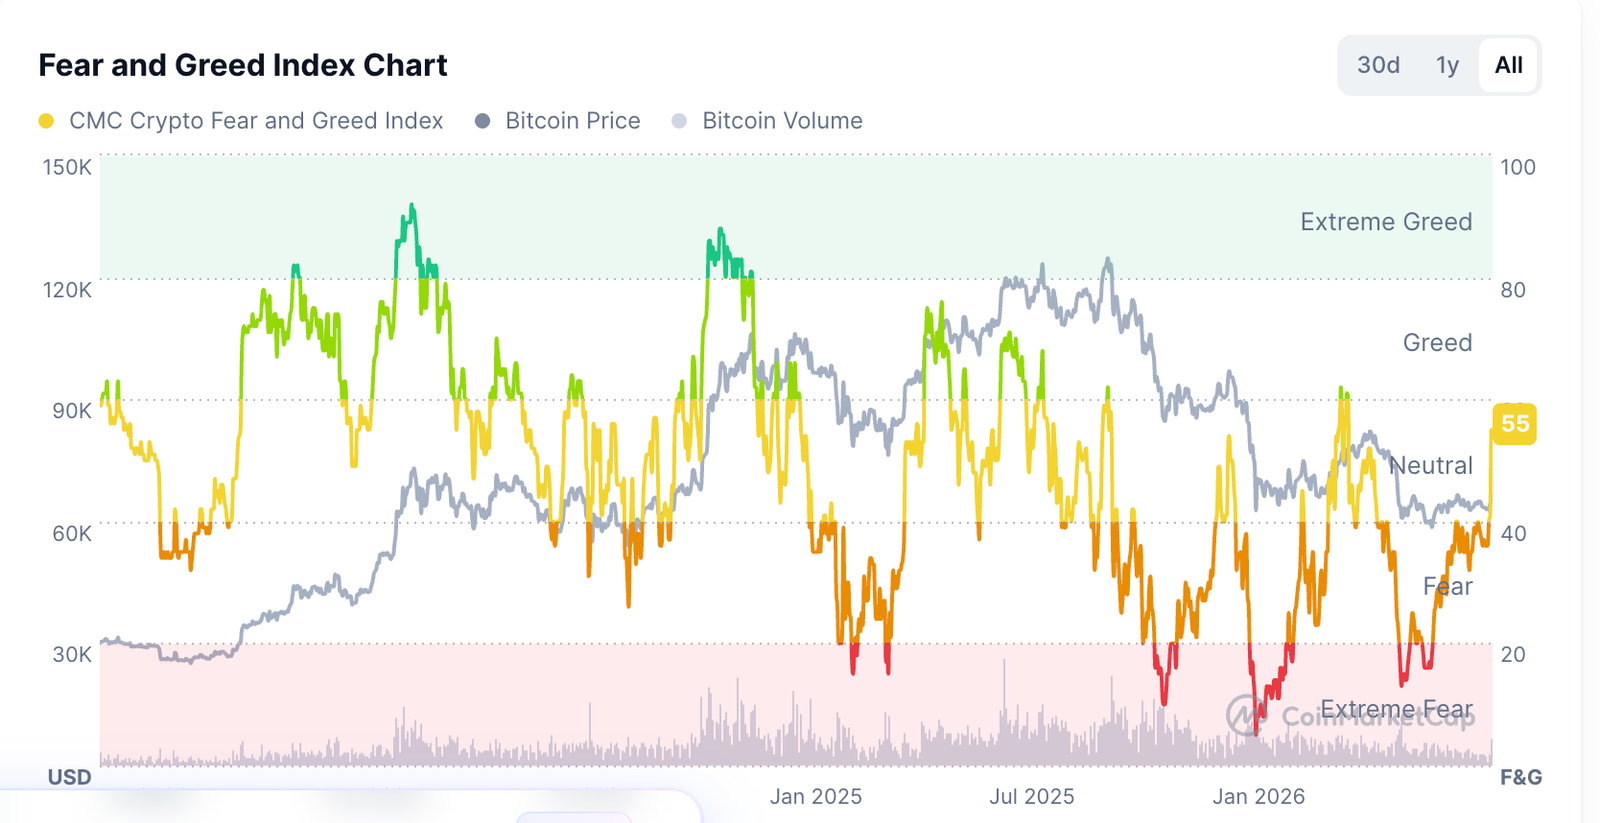
BTC price jumped sharply as investors embraced a risk-on sentiment. For one, the Crypto Fear and Greed Index has jumped to the neutral level of 55, its highest level since April 23, and much higher than this quarter’s low of 15. This rally means that it may soon moved to the greed zone of 60 in the near term.
A potential catalyst driving the ongoing Bitcoin price surge is that the US public debt is soaring and has just crossed $40 trillion. It has more than doubled in the past decade, and with the deficit spending accelerating, there is a likelihood that it will continue rising in the foreseeable future.
The rising debt explains why bond vigilantes are pushing back, with the 30-year bond yields rising to the highest level in decades. It then plunged sharply on Wednesday after Scott Bessent, the head of the Treasury, intervened by buying back the debt.
This intervention, however, will likely be in the short term. A good example is what happened earlier this month when Bessent intervened to save the Japanese yen. The currency jumped sharply shortly after that and then pared back some of these gains.
US bond yields are rising as investors remain concerned about whether the US will be able to service its debt in the long term. For one, the cost of servicing the debt soared to $1.4 trillion in the last 12 months.
In theory, Bitcoin should benefit from the rising US debt because of how it was created. Unlike the US dollar, Bitcoin has a limited supply of 21 million that cannot be tweaked. This is different from the dollar, which has an unlimited supply.
Bitcoin ETF Cumulative Inflows Reach $52.8 Billion
The Aug. 19 flows pushed cumulative net inflows into U.S. spot Bitcoin ETFs to about $52.79 billion. Total ETF net assets reached roughly $84.31 billion, equal to about 6.08% of Bitcoin’s market capitalization.
Those figures show how important ETFs have become to Bitcoin market liquidity. Unlike futures positioning, spot ETF creations generally require fund sponsors to acquire underlying Bitcoin exposure.
That means sustained inflows can produce direct spot-market demand. However, the recent recovery follows a weaker period earlier in August.
Several sessions recorded net outflows before the latest three-day rebound. The current inflow streak therefore needs to continue before investors can describe it as a durable institutional trend.
Trump Crypto Meeting Adds Regulatory Support
Regulatory developments also supported market sentiment. President Donald Trump met crypto executives on Aug. 19 and urged Congress to advance the CLARITY Act.
The proposed legislation would establish a broader U.S. digital-asset market-structure framework.
Trump’s support reduced some regulatory concerns, while the Securities and Exchange Commission and Commodity Futures Trading Commission continued advancing separate crypto rules.
However, the CLARITY Act remains unfinished. Congress still needs to complete Senate action before the legislation can reach Trump’s desk.
That makes the White House meeting a sentiment catalyst rather than a completed regulatory event.
Bitcoin Price Technicals Put $72,000 in Focus
The TradingView daily chart shows Bitcoin price breaking above the neckline of a possible inverted head-and-shoulders pattern.
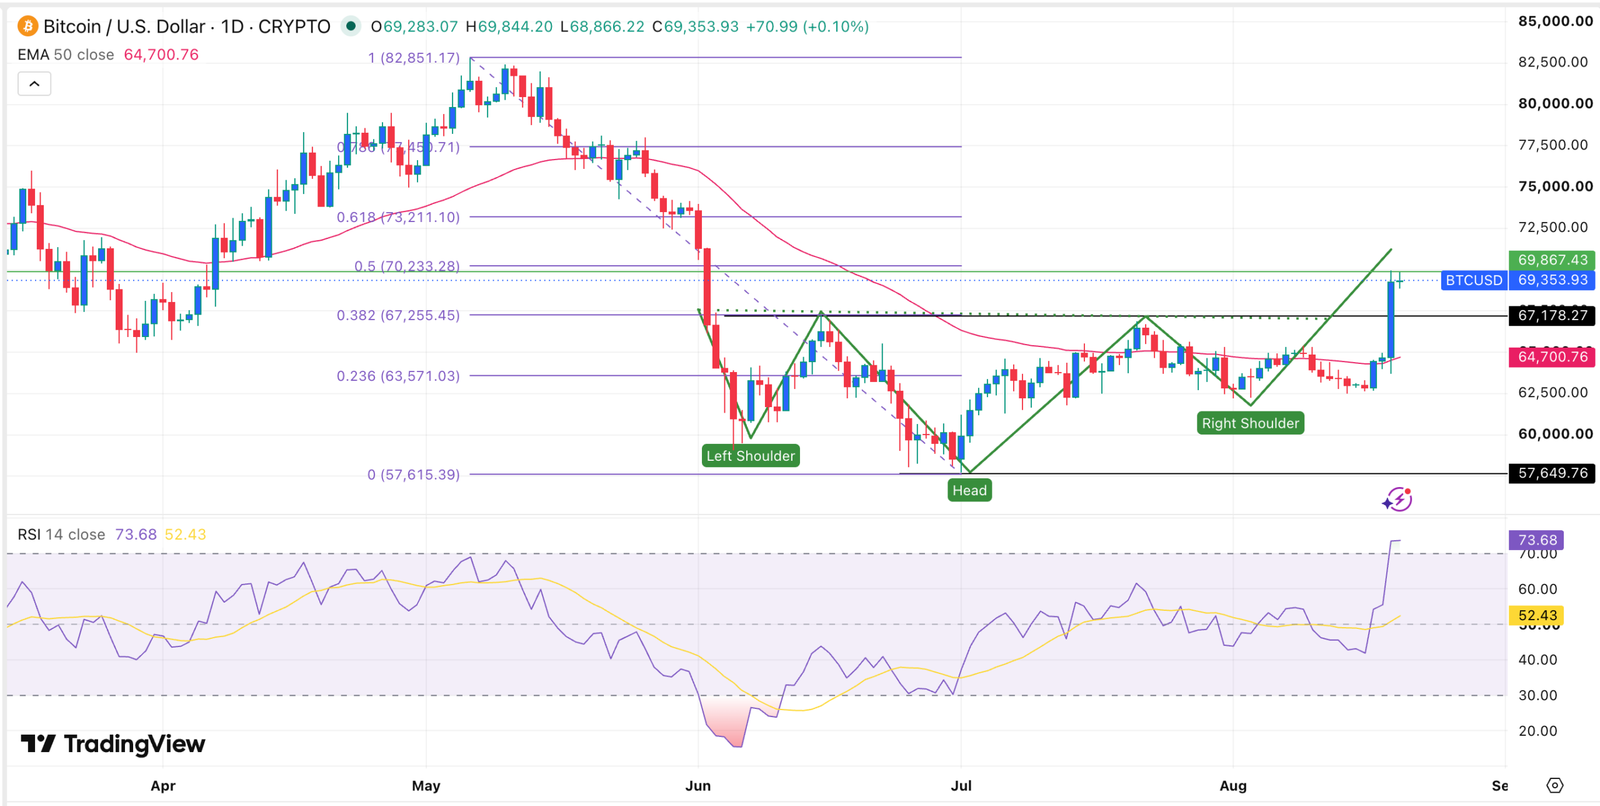
The neckline sits near $67,178. BTC also moved above its 50-day exponential moving average, strengthening the short-term recovery.
The Relative Strength Index moved near 70 on the supplied chart. That reading signals strong momentum but also shows Bitcoin entering an area where short-term buying can become stretched.
The next resistance sits around $70,000. A sustained close above that level would strengthen the breakout and shift attention toward approximately $72,000.
The downside case remains tied to $67,178. A move back below the neckline would weaken the inverted head-and-shoulders setup and raise the risk of another move toward lower support.
ETF flows provide the stronger fundamental support for the breakout. Three consecutive inflow sessions have brought roughly $1 billion into U.S. spot Bitcoin products.
For now, Bitcoin price remains close to confirming a broader recovery, but holding above $70,000 remains the immediate technical test.
Disclaimer: This article is for informational purposes only and does not constitute financial advice. Cryptocurrency markets can experience sharp price movements.
Source: www.kucoin.com
2 Comments
Pingback: Ethereum ETFs Draw $189 Million in Biggest Single – xpertsstudio
Pingback: Coinbase Global, Inc. stock surges to $160 as Bitcoin clears $71,000 – xpertsstudio