


Don't want to trade it yourself?
Our desk runs DEX portfolios on profit share.
Currencies39046
Market Cap$ 2.78T-0.54%
24h Spot Volume$ 32.25B+5.57%
DominanceBTC57.13%-0.27%ETH10.89%+0.01%
ETH Gas0.05 Gwei
MarketBitcoin
Sep 7, 2026
2min read
bySarala
forTheNewsCrypto
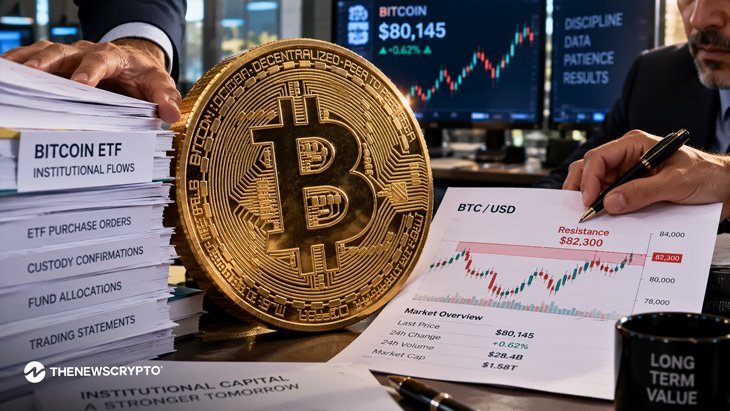
Bitcoin, the largest crypto, is trading around $80,000 after briefly topping $82,000 and is consolidating between about $79,300 and $80,500 on the 4‑hour chart; short-term technicals are mixed with the 9-day SMA near $79,860, the 21-day SMA near $80,004 and RSI around 51. U.S. spot Bitcoin ETFs pulled roughly $986.9 million in net inflows for the week ending September 5, extending a three-week streak to about $3.8 billion with a single-day high of $730.9 million, a demand-driven ETF inflow supporting price and leaving $82,000 as the key upside and $79,000–$78,500 as immediate downside levels.
See what traders are focused on
- Bitcoin is trading around $80,000 after a recent push toward the $82,000 area.
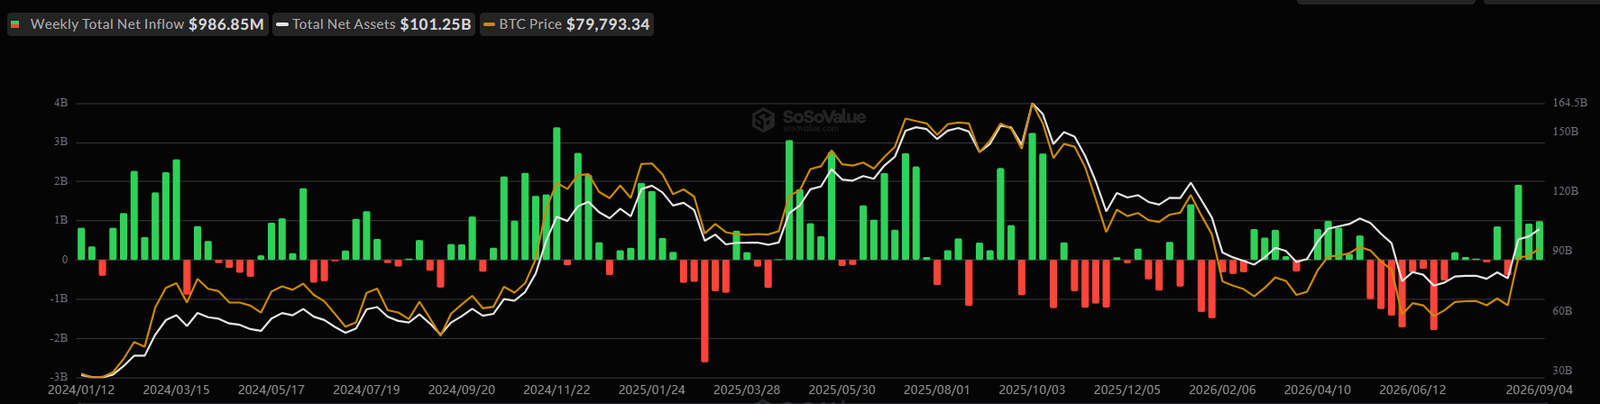
- U.S. spot Bitcoin ETFs pulled in nearly $1 billion last week, marking their third consecutive week of inflows.
The global largest crypto, Bitcoin, is holding close to the $80,000 level after a strong move earlier this month, while fresh demand from U.S. spot Bitcoin ETFs continues to support the market.
At the time of writing, BTC was trading around $79,675 on the 4-hour Binance chart, with the latest session moving between an intraday low of $79,327 and a high of $80,530. Bitcoin previously pushed above $82,000 before pulling back and settling into a tighter range between $79,000 and $81,000.
The ETF market has remained a keyion in net inflows for the week ending September 5, extending their combined three-week inflow streak to roughly $3.8 billion. Thursday alone saw about $730.9 million enter the funds, marking the strongest single-day inflow in 2026
Bitcoin 4-H Technical Setup Remains Mixed
The 4-hour chart shows Bitcoin has cooled after its latest jump, with BTC currently trading in a tight consolidation range. After climbing above $82,000, BTC pulled back and has since been moving mostly between $79,300 and $80,500. The price action suggests that buyers are still holding the recent gains, but the market has yet to build enough momentum for another move higher.
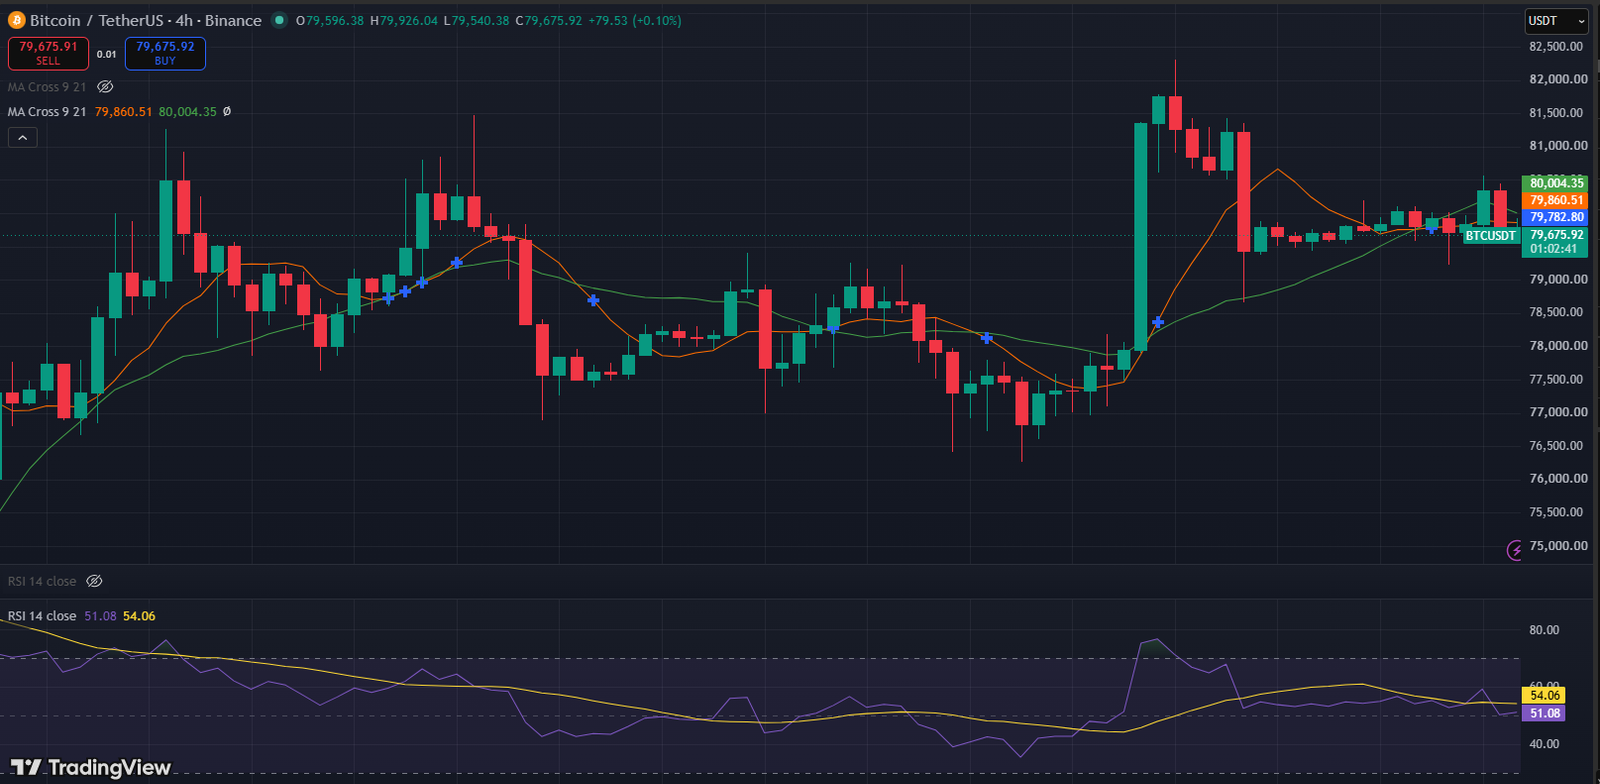
The 9-day moving average sits near $79,860, while the 21-day average is around $80,004. Right now, BTC is below both levels, leaving the short-term trend without a clear bullish signal.
The RSI is near 51, with its moving average around 54. This places momentum close to the middle of the range, rather than in either overbought or oversold territory.
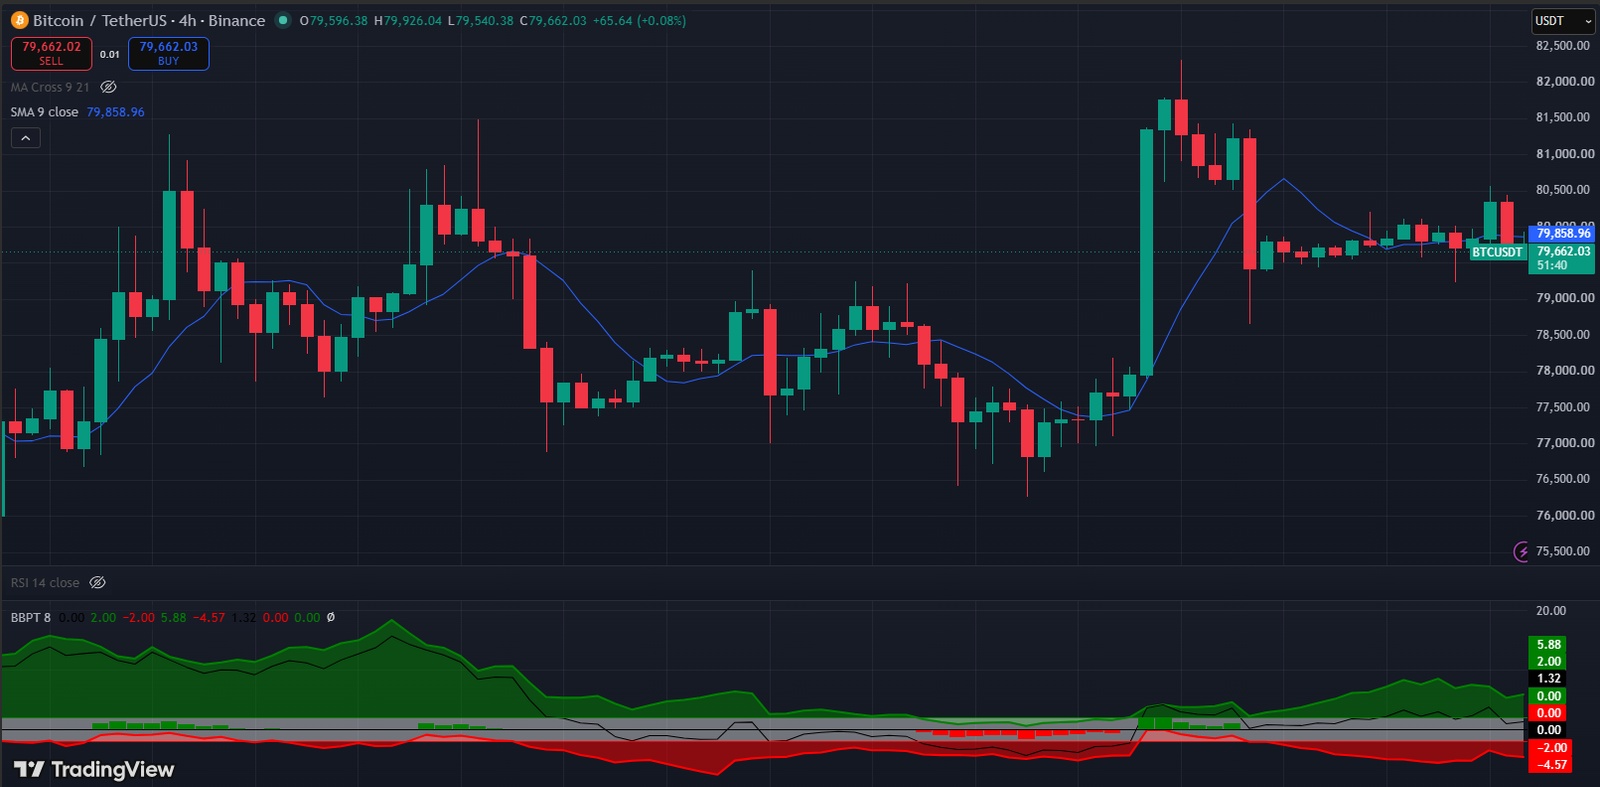
Zooming in, the visible SMA 9 is at around $79,859, meaning the price is currently slightly below the 9-day SMA. The SMA itself has flattened after rising during the earlier rally, which shows that the immediate momentum has cooled. Meanwhile, the BBPT indicator remains mixed as its green component stays above the zero line and the red component remains negative.
So, the recent price structure leaves $82,000 as the key upside level. Bitcoin briefly crossed that mark before facing selling pressure. A sustained move above it would strengthen the breakout setup.
On the downside, the $79,000 area is the first level to watch, followed by the recent low near $78,500.
For now, Bitcoin remains near $80,000 while strong ETF inflows provide support, but the 4-hour chart shows that buyers still need to reclaim the $80,000-$82,000 area to regain stronger momentum.
ZachXBT Raises WOO X Withdrawal Concerns After Users Report 3-Day Delays
Source: cryptorank.io