



Don't want to trade it yourself?
Our desk runs DEX portfolios on profit share.
<a href="https://xpertsstudio.com/hashi-protocol-wants-to-unlock-bitcoin-defi/” title=”Hashi Protocol Wants To Unlock Bitcoin DeFi”>Bitcoin surged towards $70,000 as falling US Treasury yields, improving liquidity and a huge short squeeze transformed the near-term price outlook.
The Bitcoin to US Dollar (BTC/USD) price surged almost 8% on Wednesday, climbing from around $64,600 to $69,700 and finishing the European evening close to its intraday high.
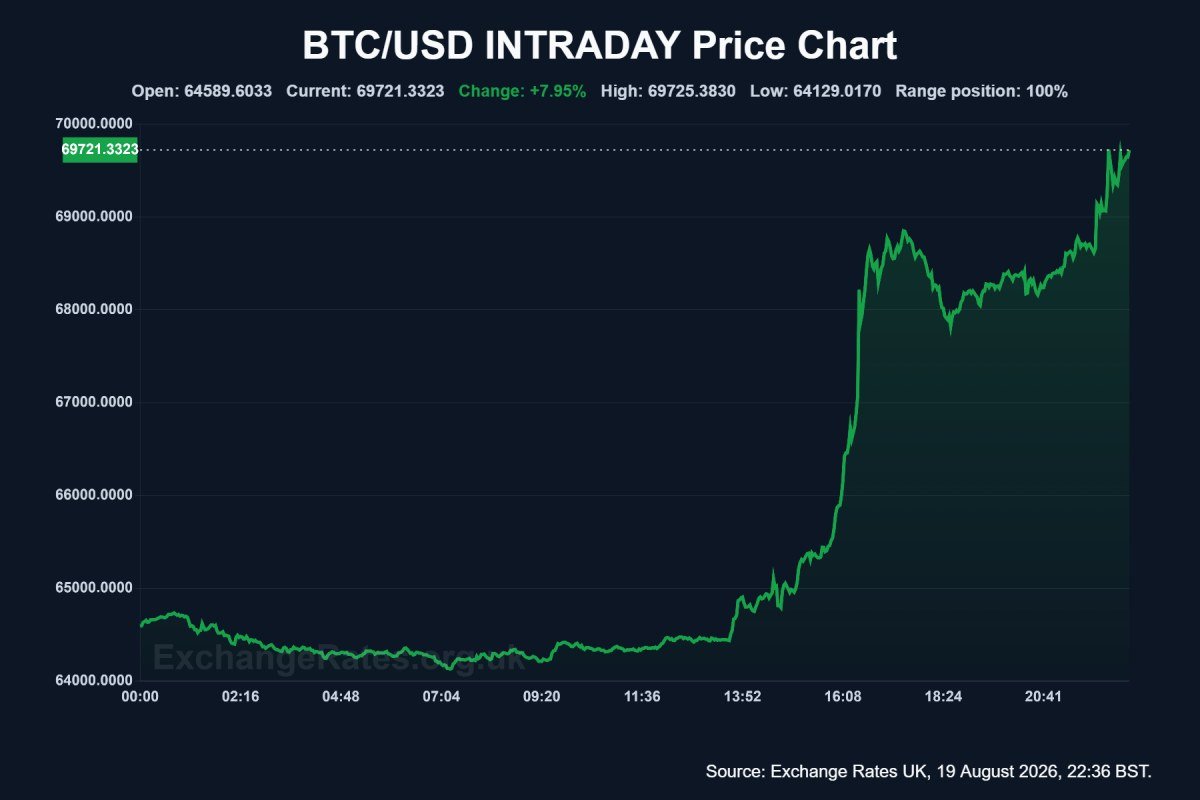
The move took Bitcoin to its strongest level in around two months and came alongside broad gains in risk assets after the US Treasury unexpectedly announced it would at least double the size of liquidity-support buybacks for longer-dated government bonds.
Long-term Treasury yields and the Dollar fell sharply in response.
The rally quickly became self-reinforcing as bearish positions were forced out. CoinDesk calculated that around $1.4 billion of crypto shorts were liquidated within four hours, while separate CoinGlass data cited by Decrypt showed more than $1.1 billion of shorts disappearing in a single hour.
Bitcoin Forecast: $70,000 Break Puts $76,000 in Sight
Paul Howard, Senior Director at digital-asset trading firm Wincent, said the Treasury move had provided the immediate catalyst.
“Bitcoin found fresh momentum today as the Fed stepped up Treasury buybacks across the 10- to 30-year segment, providing additional liquidity support at the long end of the U.S. yield curve,” Howard said.
He stressed that the programme should not be confused with conventional quantitative easing, but added that “the liquidity impact is still meaningful.”
The technical picture has also changed markedly.
Market technician Aksel Kibar identified $66,600 as the neckline of an inverse head-and-shoulders formation that has been developing since Bitcoin’s June lows.
Wednesday’s surge carried BTC decisively through that level.
Kibar calculates that confirmation of the formation produces a measured upside objective around $76,000.
Crypto trader Michael van de Poppe was more cautious about chasing the immediate move.
He said the surge through $69,000 had cleared liquidity and forced out shorts above $68,200, but expected some retracement before the next leg higher.
Van de Poppe highlighted $66,500-$67,000 as a potential buying area before a renewed move towards $72,000-$73,500.
SkyBridge Capital founder Anthony Scaramucci also sees evidence that the broader Bitcoin downturn is approaching its final stages.
“This is a clear Bitcoin bear market, and yet we’ve only had a 55% drop, whereas in other bear markets you’ve gotten a 75-80% drop,” Scaramucci said.
He described that relative resilience as “weirdly a good sign”, arguing that buyers were already beginning to position for the next phase.
VanEck has reached a similar conclusion from its market-cycle indicators.
Researchers Patrick Bush and Matthew Sigel said eight of the firm’s 12 capitulation indicators were flashing and that Bitcoin appeared to be “nearing or currently in an accumulation phase.”
Can Bitcoin Break $70,000?
The immediate test is now obvious.
Bitcoin is pressing against the psychologically important $70,000 level after breaking both its recent trading range and the $66,600 technical neckline.
A sustained close above roughly $70,000-$70,300 would strengthen the bullish signal and bring $73,000-$76,000 into view.
CoinDesk’s technical analysis identifies $76,000 as the measured target from the newly completed reversal pattern.
The more important support area is now around $66,500-$68,000.
A retreat that holds this former resistance zone would leave the breakout intact, while a sustained fall back below $66,500 would raise doubts over whether Wednesday’s surge was primarily a short squeeze.
There is also a much more bullish medium-term forecast on the table.
Standard Chartered’s Geoffrey Kendrick maintained his $100,000 end-2026 Bitcoin target in June despite the earlier market sell-off, arguing that the worst of the decline could already have passed.
For now, our near-term bias has turned more constructive.
The combination of improved liquidity, lower US yields, short covering and a technically significant breakout makes $72,000-$76,000 a credible next target zone, although some consolidation following an almost 8% one-day surge would not be surprising.
Source: www.exchangerates.org.uk