


Don't want to trade it yourself?
Our desk runs DEX portfolios on profit share.
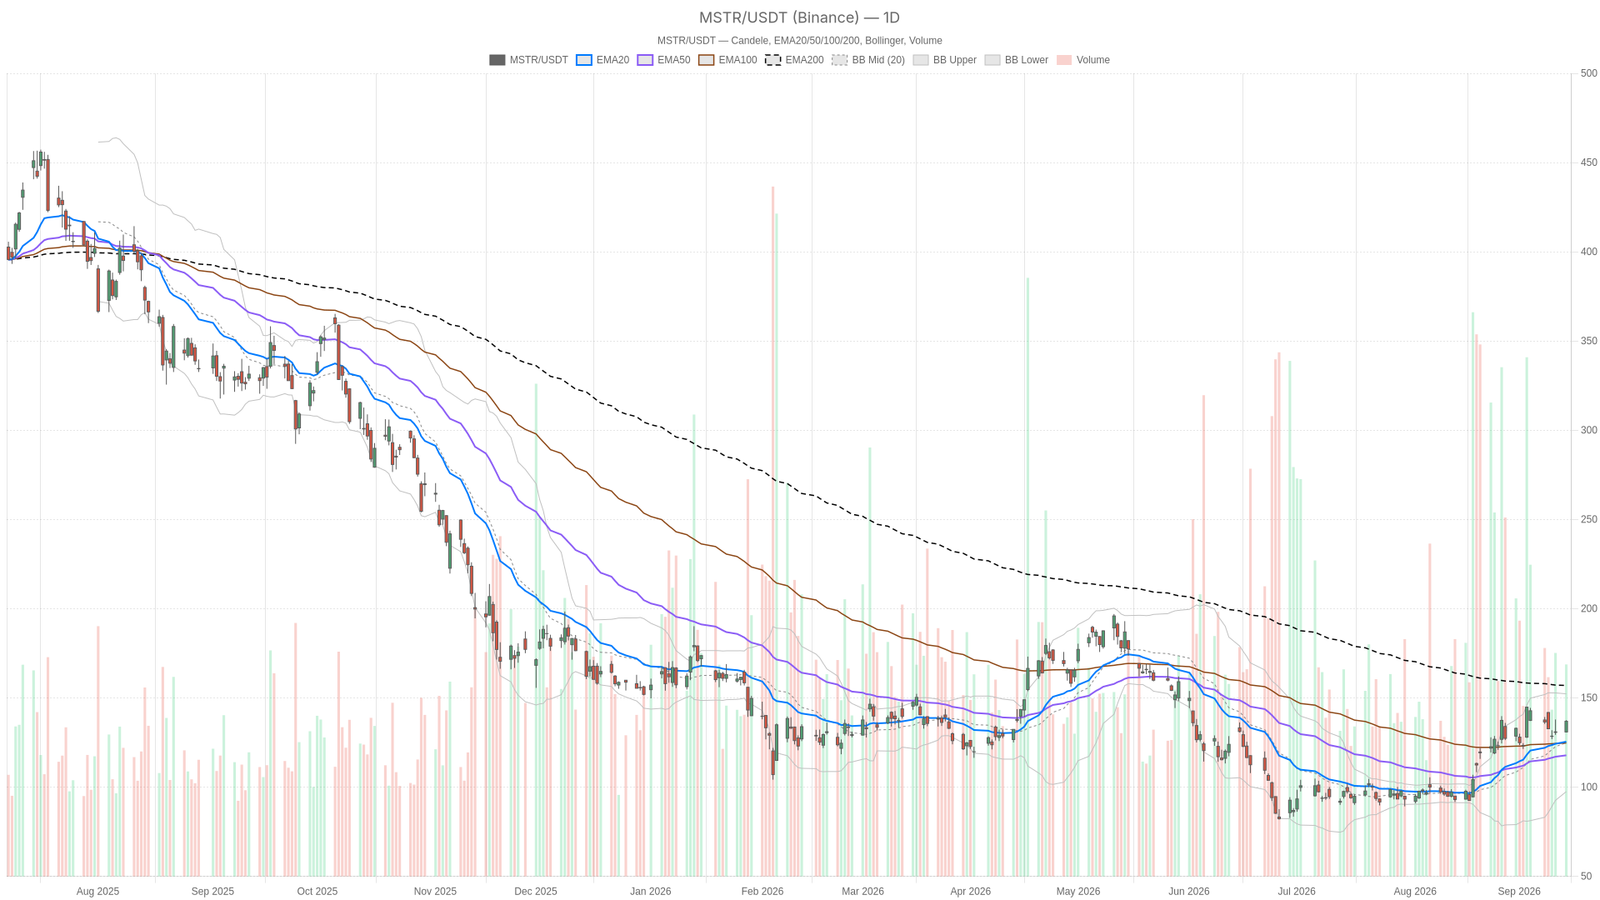
Strategy stock closed at 136.94 on September 14, surging from an intraday low of 130.73. Buyers stepped in aggressively. Yet the daily chart shows a recovery still capped by heavy overhead resistance, while shorter timeframes signal building momentum. The tug-of-war between timeframes defines the current setup.
Key takeaways
- Strategy stock (MSTR) closed at 136.94 on September 14, rallying sharply from an intraday low of 130.73.
- The daily EMA200 at 156.97 remains the critical overhead barrier preventing a full trend reversal.
- Hourly momentum is bullish with EMA20, EMA50, and EMA200 stacked in proper order beneath price.
- The 15-minute MACD histogram has turned slightly negative, signaling short-term momentum cooling near resistance.
- Strategy repurchased $139 million of STRC stock with no bitcoin trades and no ATM share sales between September 8–13, 2026, holding steady at 845,050 $BTC.
Daily Structure: Recovery, Not Yet a Trend Reversal
Strategy stock’s daily chart shows a recovery underway, but the trend reversal is not yet confirmed. MSTR trades above its EMA20 at 125.48 and EMA50 at 117.82, which confirms constructive short and medium-term momentum. However, price remains well below the EMA200 at 156.97.
EMA Alignment Remains Incomplete
That gap to the EMA200 is the single most important technical fact on the chart. Until MSTR closes that distance, the long-term trend stays capped. Shorter averages may flip bullish underneath, but the system correctly tags the daily regime as neutral rather than bullish. This is the core tension holding Strategy stock back.
RSI and MACD Flash Mixed Signals
RSI14 on the daily sits at 60.23, comfortably in bullish territory but nowhere near overbought. That leaves room for further upside without an immediate momentum ceiling.
Meanwhile, the daily MACD shows the line at 8.22 against a signal of 8.23. The histogram is essentially flat at zero. In practical terms, momentum is decelerating just as price breaks higher. It is a subtle warning that the rally may need a pause before extending meaningfully.
Volatility and Pivot Context
Bollinger Bands on the daily frame the picture well. Price sits between the mid-band at 124.89 and the upper band at 152.29. The lower band stretches all the way down to 97.49. That wide spread reflects genuine volatility in Strategy stock.
ATR14 confirms this with a reading of 9.46 — a daily range wide enough to produce sharp moves in either direction. Pivot levels reinforce the near-term battle. The pivot point sits at 135.06, with resistance at 139.39 (R1) and support at 132.61 (S1). Monday’s close above the pivot and near R1 shows buyers currently control the tape.
Hourly Timeframe Confirms the Bullish Push
The hourly chart confirms a genuine bullish push in Strategy stock. EMA20 at 134.65, EMA50 at 133.63, and EMA200 at 120.97 are all stacked in bullish order beneath price. The system explicitly labels the hourly regime as bullish.
RSI14 at 57.52 supports that read without flagging exhaustion. The hourly MACD adds weight to the case with the line at 0.70 comfortably above the signal at 0.06, producing a solid positive histogram of 0.64. Momentum here is not just positive — it is accelerating.
Price is pinned right at the hourly pivot of 136.90, testing resistance at 137.52 (R1) while support sits close behind at 136.29 (S1). Therefore, the hourly structure confirms the daily recovery attempt. Yet the bigger picture remains capped by the EMA200 far overhead. That is the core conflict in Strategy stock. The shorter-term trend is clearly bullish, while the daily trend is only beginning to repair itself.
15-Minute Execution: Momentum Cooling Near Resistance
The 15-minute chart shows short-term momentum cooling as MSTR tests overhead resistance. EMA20 at 136.03, EMA50 at 134.87, and EMA200 at 134.36 all slope upward beneath the current close of 136.91. RSI14 at 59.18 remains constructive.
Notably, though, the 15-minute MACD histogram has flipped slightly negative at -0.06. The line at 0.73 dips just below the signal at 0.79. That is a small but real sign that short-term momentum is cooling right into resistance.
Price trades near the upper Bollinger Band at 137.40 and just under the 15-minute pivot of 136.96. Resistance sits at 137.46 and support at 136.40. In other words, execution-level price action is consolidating at the ceiling flagged by both the hourly and daily charts. This is typical behavior before either a breakout continuation or a short-term pullback. The 15-minute frame alone cannot resolve which comes next.
Strategy Stock News: Buybacks Over Bitcoin Accumulation
Strategy’s latest disclosures reveal a shift toward balance sheet discipline over aggressive bitcoin accumulation. The company repurchased $139 million of STRC stock. According to Seeking Alpha, it made no bitcoin trades and sold no shares under its ATM program between September 8 and 13, 2026, holding steady at 845,050 $BTC.
That combination — no dilution through ATM sales, continued STRC buybacks, and unchanged Bitcoin holdings — signals a company prioritizing balance sheet discipline over aggressive accumulation for now.
Separately, Investing.com noted the stock rallied earlier in the week as firm August consumer price growth boosted expectations for a Fed rate move. This macro driver continues to influence sentiment around Strategy stock alongside its crypto-linked profile.
Bullish Scenario for Strategy Stock
The bullish scenario for Strategy stock depends on a clean break above daily R1 at 139.39. Sustained by the current hourly bullish regime, such a move would open room toward the daily Bollinger mid-to-upper zone.
For this to gain real credibility, price eventually needs to close the gap toward the EMA200 at 156.97. That level stands between a short-term bounce and a genuine trend reversal. Supportive buyback activity and stable Bitcoin holdings, without additional share dilution, provide a fundamental tailwind that could reinforce technical strength if momentum holds.
Bearish Scenario for Strategy Stock
The bearish scenario hinges on Strategy stock failing to hold the hourly pivot zone around 136.29–136.90. A breakdown there would invalidate the near-term bullish setup. A drop back toward the daily EMA20 at 125.48, or down to the daily S1 at 132.61, would suggest the recovery attempt lost steam before threatening the EMA200 resistance overhead.
Given the elevated daily ATR of 9.46, such a reversal could unfold quickly. Macro catalysts tied to Fed rate expectations add another layer of risk that could pressure Strategy stock regardless of its own technical setup.
Closing Take on Strategy Stock
Strategy stock is caught between a confirmed short-term uptrend and an unresolved daily structure. The hourly and 15-minute frames agree on direction, but the daily EMA200 remains a significant overhead barrier.
Meanwhile, volatility stays elevated across every timeframe, and news flow around buybacks and steady Bitcoin holdings offers support without removing uncertainty. Positioning here should account for that wide range potential. Both the bullish continuation and the bearish pullback scenarios remain live until price resolves decisively against the key levels outlined above.
What is the current price of Strategy stock (MSTR)?
Strategy stock closed at 136.94 on September 14, rallying sharply from an intraday low of 130.73.
What is the key resistance level for MSTR right now?
The critical overhead barrier is the daily EMA200 at 156.97. Below that, daily R1 at 139.39 serves as immediate resistance.
Is the short-term trend for Strategy stock bullish or bearish?
The hourly chart is explicitly bullish, with EMA20, EMA50, and EMA200 stacked in proper order beneath price. However, the daily trend remains neutral and has not yet confirmed a full reversal.
Did Strategy make any bitcoin purchases recently?
No. Between September 8 and 13, 2026, Strategy made no bitcoin trades and sold no shares under its ATM program. The company held steady at 845,050 $BTC while focusing instead on repurchasing $139 million of STRC stock.
Disclaimer: This article is for informational purposes only and does not constitute financial advice, an investment recommendation, or a solicitation to buy or sell any financial instrument or cryptocurrency. The analysis provided is not indicative of future results. Investing in crypto assets and financial markets carries a high risk of capital loss. Always do your own research (DYOR) and consult a qualified financial advisor before making any decision.
Article produced with the assistance of artificial intelligence and reviewed by the editorial team.
Source: cryptonews.net