


Don't want to trade it yourself?
Our desk runs DEX portfolios on profit share.
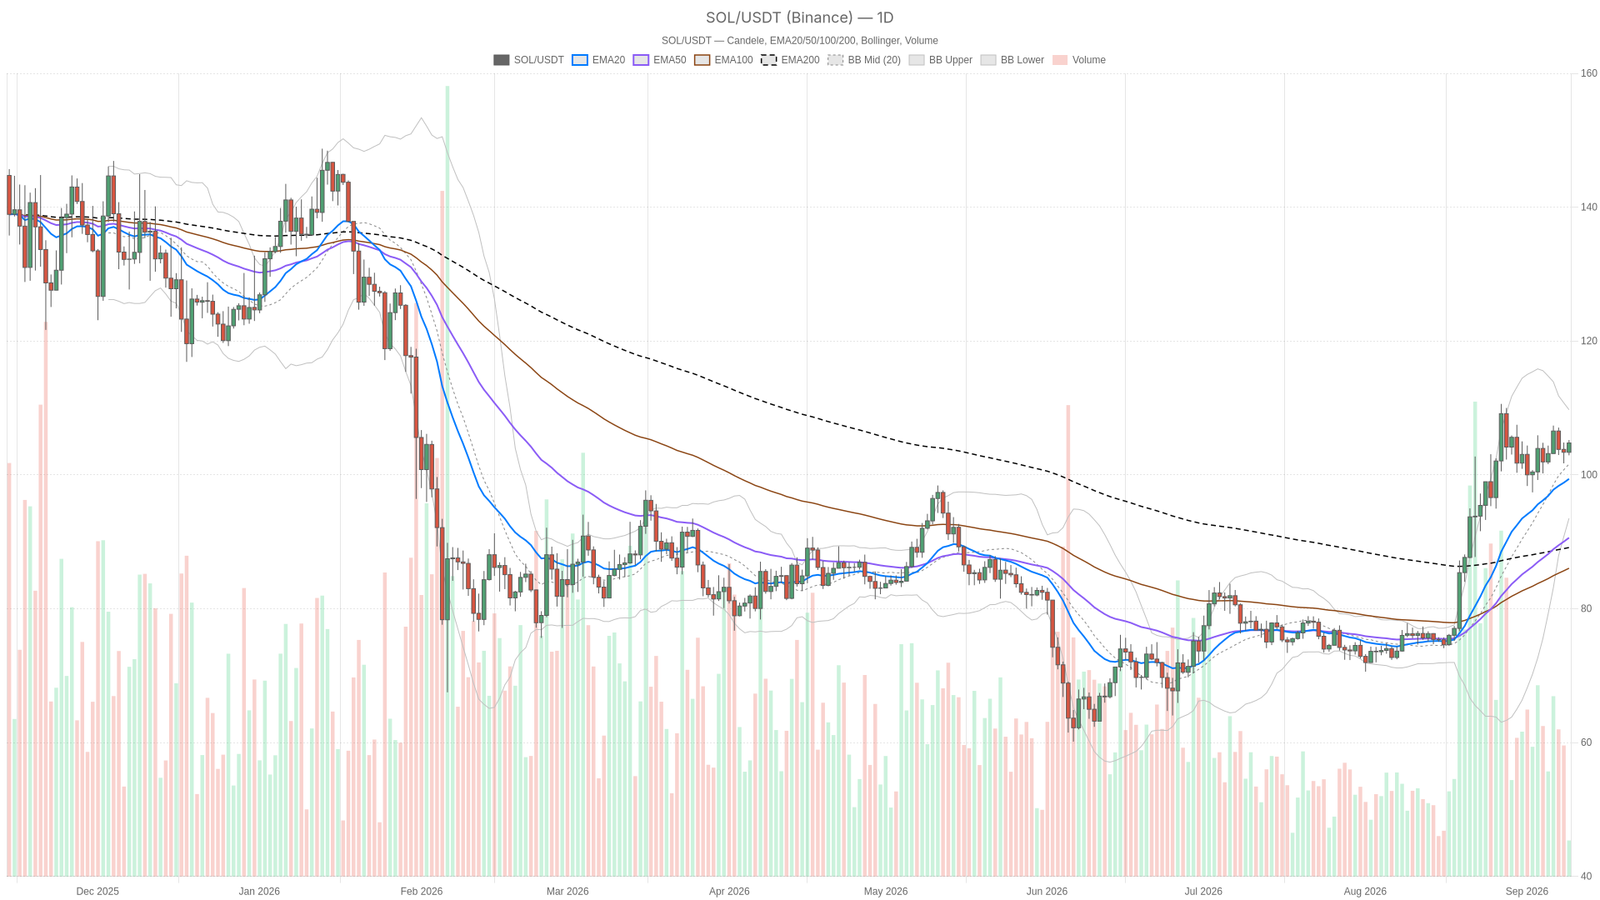
On September 9, 2026, the Solana price today trades around $104.76, with bulls defending a critical support zone as the broader crypto market dips 0.57% to roughly $2.72 trillion On-chain activity across Solana’s DeFi ecosystem is surging, adding fundamental strength to an already constructive technical picture
Key takeaways
- $SOL trades near $104.76 with <a href="https://xpertsstudio.com/bitcoin-price-holds-near-79k-as-cycle-drawdowns-narrow/” title=”Bitcoin price holds near $79K as cycle drawdowns narrow”>Bitcoin dominance at 58.41% and the Fear & Greed Index at 66, firmly in Greed territory.
- The daily trend is bullish, with EMA20, EMA50 and EMA200 aligned upward, though the MACD histogram is negative at -0.61, signaling fading momentum.
- Key battle lines: daily pivot at $104.29, R1 at $105.67, S1 at $103.39, and the upper Bollinger Band near $109.72.
- On-chain DEX fees are surging sharply, led by Raydium (+363% monthly) and Orca (+80.78% monthly), signaling genuine network activity.
- A bullish breakout requires a decisive close above R1 at $105.67; the bearish scenario activates on a loss of S1 at $103.39.
Trend Structure Says Bullish, But Momentum Is Cooling
On the daily timeframe, Solana’s regime is classified as bullish. The EMA structure backs that up cleanly: price at $104.76 sits above the EMA20 ($99.39), EMA50 ($90.60), and EMA200 ($89.13). That is a textbook uptrend alignment, with the short-term average above the medium-term and the long-term, and the gap between spot price and the longer EMAs is wide enough to suggest this rally carries real weight.
The daily RSI at 63.59 supports the bullish read without pushing into overbought territory. It sits comfortably above the 50 midline, showing buyers remain in control, yet it is not screaming exhaustion. There is still room to run before RSI-based mean reversion becomes a serious threat.
Where the story grows more complicated is the daily MACD. The line sits at 5.36 versus a signal at 5.98, producing a negative histogram of -0.61. That is a classic momentum deceleration signal: price is still trending up, but the thrust behind that move is fading. It does not invalidate the uptrend, but it does suggest the easy gains may be behind us for now.
Bollinger Bands, ATR and Pivot Levels: Where the Real Battle Lines Are
The daily Bollinger Bands frame the current range with precision: mid-band at $101.61, upper band at $109.72, lower band at $93.50. Price hovers near the mid-to-upper zone, closer to the top than the bottom. This tells you the asset is not yet at a stretched, overbought extreme, and there is still room toward $109.72 before volatility bands start pushing back against further upside.
Daily ATR reads 4.93, a meaningful volatility cushion at this price level. Moves of $4 to $5 in either direction should not be treated as trend-breaking noise. The daily pivot sits at $104.29, with R1 at $105.67 and S1 at $103.39. Price trading right on top of the pivot tells you the market is in a decision zone. A clean push through R1 opens the door toward the upper Bollinger Band, while losing S1 would hand control back to sellers.
Multi-Timeframe Check: Intraday Charts Are Cooling, Not Reversing
The 1H chart is labeled neutral, and the numbers explain why. EMA20 ($103.81), EMA50 ($103.88), and EMA200 ($103.88) are stacked nearly on top of each other. That is a flattening structure, not a trending one. RSI at 60.54 is mildly constructive but far from decisive.
However, the one bright spot is the 1H MACD. The line at 0.17 sits above a signal of -0.01, producing a small positive histogram of 0.17. Intraday buyers are quietly stepping back in even as the broader hourly trend takes a breather. That said, the move remains tentative and needs follow-through.
The 15-minute picture, also neutral, shows RSI at 65.76, the strongest reading across all three timeframes. A still-positive MACD histogram of 0.07 suggests short-term dips are being bought quickly rather than snowballing into deeper corrections, even if the hourly trend has not fully committed either way.
The On-Chain Backdrop: Solana’s DeFi Activity Is Heating Up
Away from the charts, Solana’s on-chain economy is showing real strength. Data shows Raydium AMM’s fees up 363.22% over the past 30 days and 121.46% over the past 7 days. Orca DEX posted an 80.78% monthly gain in fees, despite a rough single-day drop of -50.48%. Meanwhile, BisonFi is up 102.34% over 30 days, and HumidiFi has climbed 40.89% in the same window.
PumpSwap cooled off with fees down -15.61% daily and -10.91% weekly, though it is still up 28.28% over the month. This matters for the technical picture because sustained increases in DEX fee generation typically track with genuine trading and liquidity activity. It offers a supportive backdrop for the bullish daily structure and can help absorb selling pressure if $SOL pulls back toward the pivot or S1.
Bullish and Bearish Scenarios
The bullish case is straightforward: a decisive close above the daily R1 at $105.67, ideally accompanied by a daily MACD histogram flipping positive again, would confirm that momentum is catching back up with trend structure. That opens a path toward the upper Bollinger Band near $109.72. This scenario gets invalidated if price stalls repeatedly at R1 without volume follow-through.
The bearish case centers on a loss of the daily pivot at $104.29 and a subsequent break below S1 at $103.39. That would shift short-term control to sellers and put the EMA20 at $99.39 back in play as a mean-reversion magnet. This scenario is invalidated if buyers defend S1 and the hourly MACD histogram keeps expanding positive, confirming that dip-buying remains the dominant behavior.
Where This Leaves Traders
Right now, the Solana price today reflects a market caught between a bullish daily structure and momentum that is beginning to fade. A Fear & Greed reading of 66, paired with Bitcoin dominance at 58.41%, suggests capital has not fully rotated into altcoins. That creates a setup that rewards patience over conviction in either direction. Volatility, as measured by the daily ATR near $4.93, is real enough that both the bullish breakout and bearish pullback scenarios are live possibilities within the same week. Sizing positions with that volatility in mind, while letting price action at the pivot and R1/S1 levels do the talking, remains the prudent approach.
What is Solana’s current price level?
As of September 9, 2026, $SOL trades around $104.76, sitting just beneath a cluster of daily resistance levels while the broader crypto market shows a slight cooldown.
Which support and resistance levels matter most for $SOL right now?
The daily pivot at $104.29 is the immediate decision line, with R1 at $105.67 serving as the key breakout trigger and S1 at $103.39 acting as the critical support. The upper Bollinger Band near $109.72 marks the next major upside target.
Is Solana’s daily trend still bullish?
Yes. The EMA20, EMA50, and EMA200 are stacked in textbook bullish alignment, and the daily RSI at 63.59 remains constructively above the 50 midline. However, the daily MACD histogram is negative, signaling that momentum is cooling even as the trend holds.
What is driving Solana’s on-chain activity?
DEX fee generation has surged across multiple platforms, led by Raydium with a 363% monthly increase and Orca with over 80% growth. This suggests genuine trading and liquidity demand on the network rather than purely speculative price chasing.
Disclaimer: This article is for informational purposes only and does not constitute financial advice, an investment recommendation, or a solicitation to buy or sell any financial instrument or cryptocurrency. The analysis provided is not indicative of future results. Investing in crypto assets and financial markets carries a high risk of capital loss. Always do your own research (DYOR) and consult a qualified financial advisor before making any decision.
Article produced with the assistance of artificial intelligence and reviewed by the editorial team.
Source: cryptonews.net