

Don't want to trade it yourself?
Our desk runs DEX portfolios on profit share.
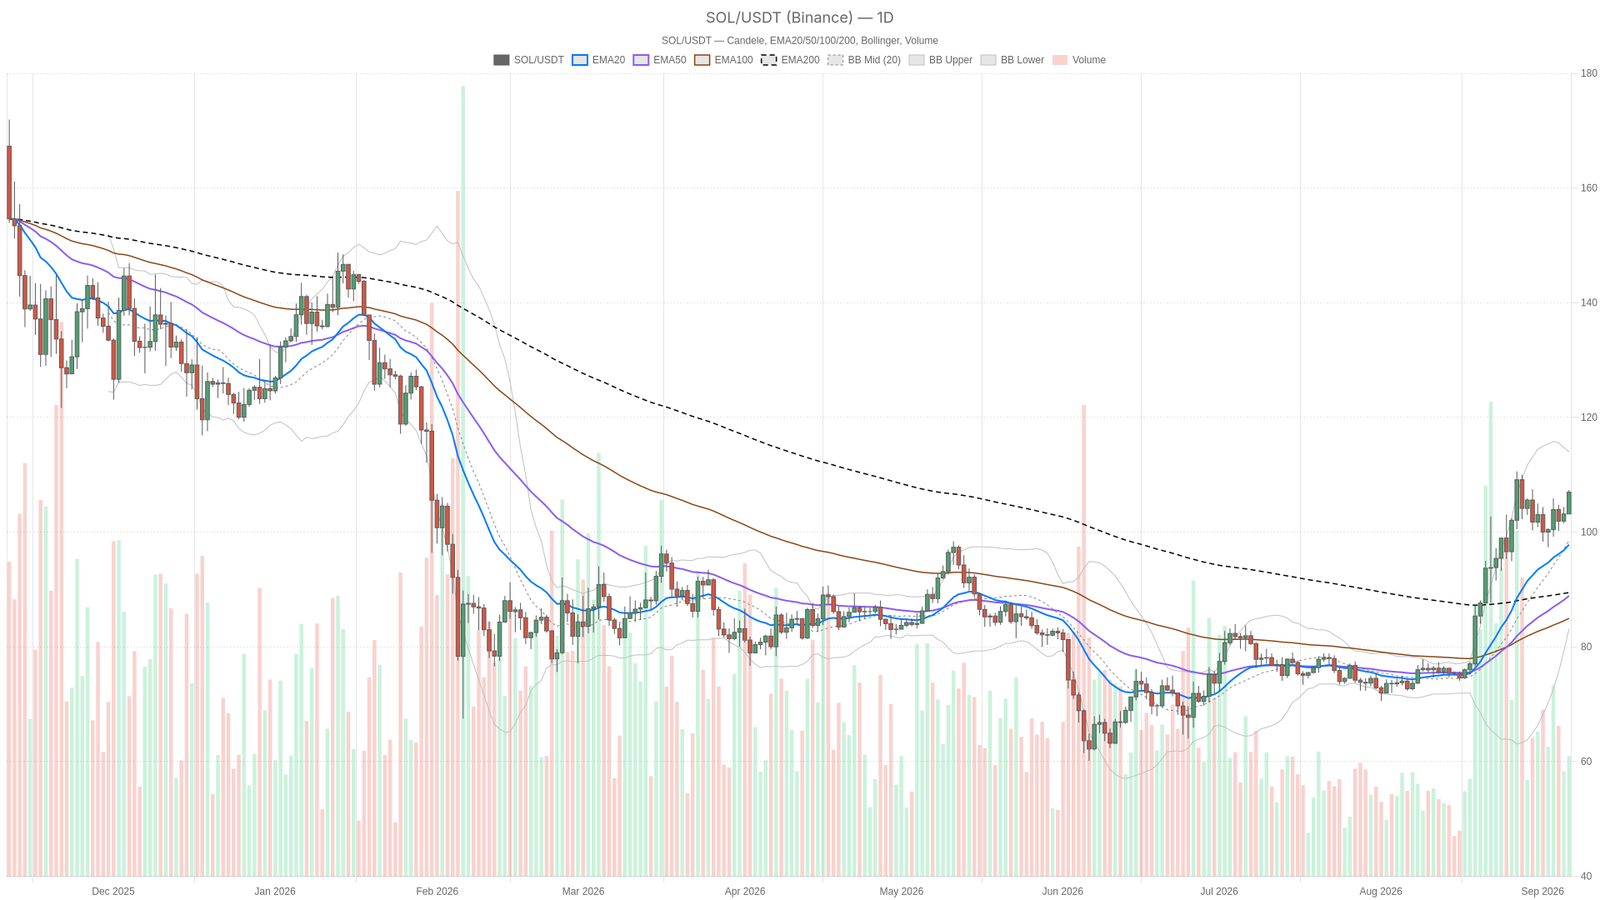
Trading near $106.98 on September 6, 2026, Solana crypto sits at a decisive resistance shelf that will likely determine the next directional move. The daily chart shows price stretched above every major moving average, yet momentum gauges are beginning to fade exactly where conviction is most needed.
Key takeaways
- $SOL holds comfortably above its 50 and 200-day EMAs, maintaining a textbook bullish stack on the daily timeframe.
- Daily RSI14 at 68.52 flirts with overbought territory while the MACD histogram turns negative at -0.22, signalling decelerating momentum.
- The 107–108.50 resistance band — a confluence of daily R1 and short-term pivots — is the critical zone to watch for the next leg.
- On-chain DEX fee data shows PumpSwap fees up 123.14% in 24 hours, with Raydium, Orca, and BisonFi all posting double-digit monthly gains.
- Daily ATR of 5.75 combined with tight hourly compression suggests volatility is likely to expand sharply from current levels.
Daily Structure: Strong Trend, Cooling Engine
The daily trend remains structurally bullish. Price at 106.98 sits well above the 20-EMA at 97.82, the 50-EMA at 88.91, and the 200-EMA at 89.49 — a clean alignment where the short-term average leads the long-term ones. That is precisely the kind of stack trend-following traders want to see. However, the momentum picture is less straightforward than the trend itself.
RSI14 at 68.52 confirms sustained demand, yet it also places the market near overbought territory, meaning fresh buyers are paying a premium. More tellingly, the daily MACD line at 6.16 sits below its signal line at 6.38, producing a negative histogram of -0.22. Price remains elevated, but the thrust that carried it there is decelerating. The system tags the daily regime as neutral, which aligns with the broader picture: strong positioning paired with weakening acceleration.
1H Confirmation: Bulls Still in Control
The hourly frame offers a cleaner bullish read. EMA20 at 105.44, EMA50 at 104.13, and EMA200 at 102.89 are stacked correctly beneath the close of 106.99, and the MACD histogram here is actually positive at 0.13 — the opposite of the daily signal. RSII14 at 68.93 runs hot, but hourly momentum has not yet cracked. This is the timeframe that backs the bulls in the near term.
On the 15-minute chart, however, the tension becomes visible in real time. RSI14 has cooled to 60.2 from the hourly’s 68.93, and the MACD histogram has flipped slightly negative at -0.02. Price is glued to the upper Bollinger Band at 107.08 and sits almost exactly at the 15m pivot resistance at 107.07. Buyers are running out of room to push without a pause, and this level is where execution decisions are being made right now.
Bollinger Bands and Pivot Levels
The daily Bollinger midline rests at 98.54, with the upper band at 113.96 and the lower band at 83.13. Price at 106.98 is comfortably above the midline and pressing toward the upper third of the range — extended, but with genuine room left before the band itself becomes the ceiling. The daily ATR14 of 5.75 signals that volatility remains meaningful; a swing of that magnitude in either direction during a single session would not be unusual.
On the hourly chart, price near 106.99 presses the upper Bollinger Band at 107.96 with an ATR of just 1.04 — a tight, compressed range that typically resolves with a sharp move once it breaks. Moreover, compression at resistance is precisely the kind of setup that can go either way violently. The daily pivot point sits at 105.84, with R1 at 108.50 and S1 at 104.31. Price closing near 106.98 puts it above the pivot but still short of R1, meaning the bulls have won the first fight without yet clearing the next checkpoint.
Broader Market and On-Chain Context
The Fear & Greed Index reads 73, firmly in Greed territory, even as total crypto market capitalisation slipped 2.93% in a single day Bitcoin dominance near 59.19% adds further pressure — a combination that normally squeezes altcoins. That $SOL is pushing sideways near multi-week highs while the rest of the tape bleeds suggests either genuine relative strength or a lagging move that has not yet caught up with the broader risk-of tone
Solana’s own on-chain activity adds meaningful context. PumpSwap fees surged 123.14% in 24 hours and 23.72% over 30 days, while Raydium AMM and Orca DEX posted double-digit monthly gains despite mixed daily swings. BisonFi fees are up 118.4% over the past month. That kind of surge in trading fee generation across Solana’s DEX ecosystem points to real, active network usage — backing Solana crypto with structural demand that extends well beyond pure technicals.
Bullish and Bearish Scenarios
Bullish case
If $SOL clears the 107.07–108.50 resistance band — the confluence of 15m and 1h pivots plus the daily R1 — with genuine volume behind it, the path opens toward the daily Bollinger upper band near 113.96. The hourly trend structure already supports this outcome, and continued strength in on-chain fee activity across PumpSwap, Raydium, and BisonFi would reinforce a genuine demand story. This scenario gets invalidated quickly if price fails to hold above the 1H EMA20 at 105.44.
Bearish case
The daily MACD histogram turning negative, RSII readings above 68 on both daily and hourly charts, and the 15m momentum cooling all together build a credible case for a pullback. A rejection at the current resistance shelf could send price back toward the daily pivot at 105.84, with a deeper flush targeting S1 at 104.31 — a level that also sits near the hourly 50-EMA at 104.13. This case is undermined if $SOL reclaims and holds above 108.50 with hourly MACD momentum expanding rather than fading.
Final Positioning Read
The signals here genuinely disagree, and that is worth stating plainly. The daily chart shows a mature uptrend with a tired engine. The hourly chart still backs the bulls. The 15-minute chart shows hesitation exactly at resistance. None of these readings are wrong — they are simply describing different layers of the same market at the same time, and that layering is what makes this moment tricky rather than obvious.
Given the daily ATR of 5.75 and the tight hourly compression against resistance, volatility is likely to expand from here in one direction or the other rather than stay this quiet. The 107–108.50 zone is the line in the sand. Whichever side wins that fight is likely to set the tone for the next several sessions. This is a moment for discipline around invalidation levels rather than conviction on direction — the market itself has not fully decided yet.
What are the key resistance levels for Solana right now?
The critical resistance zone sits between 107.07 and 108.50, a confluence of the 15-minute and hourly pivot resistances plus the daily R1. A clean break above this band with volume would open the path toward the daily Bollinger upper band near 113.96.
Is Solana’s uptrend still intact based on technical indicators?
Yes, structurally. Price holds above the 20-EMA, 50-EMA, and 200-EMA in a textbook bullish stack. However, the daily MACD histogram has turned negative and RSII readings are approaching overbought territory, suggesting the trend is mature and momentum is decelerating.
What does on-chain activity suggest about Solana’s demand?
On-chain data points to genuine network usage. PumpSwap fees rose 123.14% in 24 hours and 23.72% over 30 days, while Raydium, Orca, and BisonFi all posted double-digit monthly fee growth, indicating real trading activity rather than purely speculative token flows.
What should traders watch in the short term?
The 107–108.50 zone is the immediate battleground. A rejection could send price toward S1 at 104.31, while a breakout above 108.50 with expanding hourly MACD momentum would favour the bullish case toward 113.96. The tight hourly compression and daily ATR of 5.75 suggest a sharp move is likely once this range resolves.
Disclaimer: This article is for informational purposes only and does not constitute financial advice, an investment recommendation, or a solicitation to buy or sell any financial instrument or cryptocurrency. The analysis provided is not indicative of future results. Investing in crypto assets and financial markets carries a high risk of capital loss. Always do your own research (DYOR) and consult a qualified financial advisor before making any decision.
Article produced with the assistance of artificial intelligence and reviewed by the editorial team.
Source: cryptonews.net
1 Comment
Pingback: Arbitrum co-founder defends Robinhood’s 90% fee share – xpertsstudio