


Don't want to trade it yourself?
Our desk runs DEX portfolios on profit share.
- Buyers defend $0.07-$0.086, while $0.086 remains the immediate confirmation threshold for broader recovery momentum and continuation.
- DOGE needs $0.10-$0.108 clearance before the longer-term $0.15-$0.20 projection becomes technically relevant for confirmation now.
- Defending $0.07 preserves recovery potential, while a sustained breakdown would weaken the reversal structure and recovery outlook.
Dogecoin reversal remains under scrutiny as price holds near a key range following months of correction, while buyers now test resistance around $0.086 after August’s sharp recent recovery.
Buyers Test the Upper Boundary
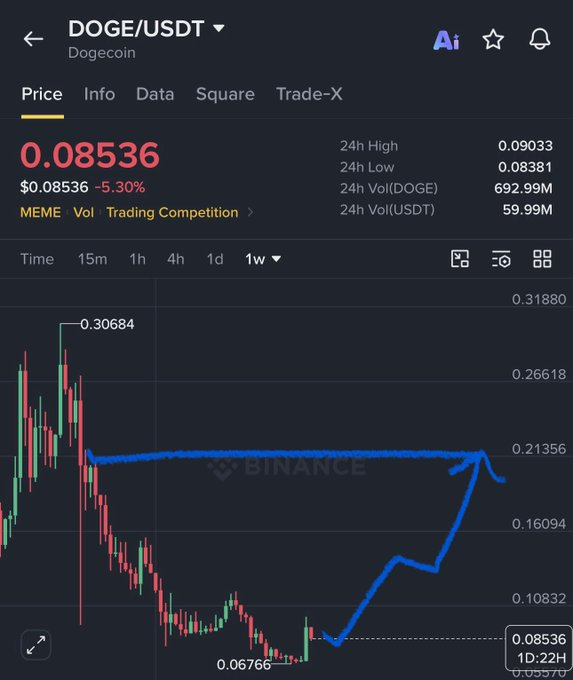
DOGE is trading near $0.0843, keeping price inside the highlighted reversal range. The zone stretches from $0.07-$0.086 across the supplied chart. Price therefore remains close to resistance rather than the range’s lower boundary.
The weekly structure shows a prolonged decline from the $0.30684 peak. That decline produced repeated lower highs and lower lows across several weeks. Selling pressure eventually pushed price toward the marked $0.06766 low.
The $0.07 region now serves as an important historical support reference. Meanwhile, $0.086 represents the immediate ceiling within the current consolidation. A sustained break above that ceiling would provide stronger recovery confirmation.
Crypto GVR identified this range as an area requiring close market attention. The post points toward recovery signs if buyers defend the zone. It also places $0.15-$0.20 among the longer-term areas to monitor.
August Recovery Loses Some Momentum
DOGE accelerated higher during August after spending weeks near lower levels. The move briefly carried price toward the $0.10-$0.11 region. Trading volume also expanded noticeably during that upward move.
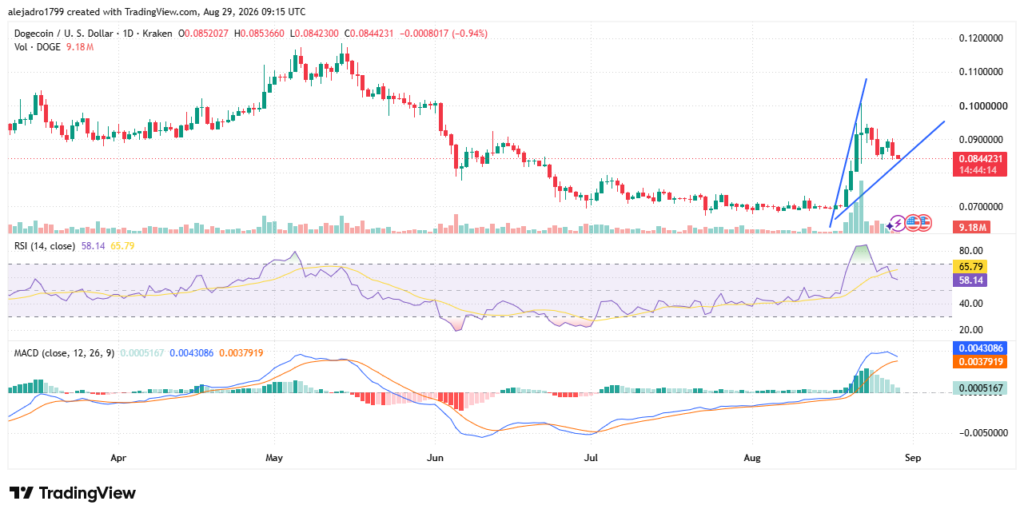
Price has since retreated and settled closer to $0.0843. That pullback leaves the token near the upper portion of its reversal range. The current structure therefore depends heavily on resistance around $0.086.
The daily chart shows an ascending blue trendline beneath recent price action. That line connects the developing higher-low structure from the August advance. Holding above it would preserve the current short-term recovery pattern.
Momentum indicators have also cooled following the earlier surge. The RSI stands near 58 after previously reaching elevated levels. The MACD remains positive, although its histogram has contracted recently.
Resistance Determines the Next Technical Move
A move above $0.086 would shift attention toward the $0.09 area. That level sits directly ahead of the larger $0.10 resistance. Therefore, buyers face several nearby barriers before reaching higher targets.
The chart places another resistance area around $0.10-$0.108. A sustained breakout there would strengthen the recovery from recent lows. It would also bring the projected higher range closer into focus.
The blue projection eventually points toward $0.15-$0.20. However, that path remains conditional on reclaiming successive resistance levels. The chart does not establish those projected levels as confirmed price action.
On the downside, $0.07 remains the key support reference. A sustained break beneath that area would weaken the recovery structure. Conversely, continued defense would keep the broader setup technically active.
Source: www.kucoin.com