


Don't want to trade it yourself?
Our desk runs DEX portfolios on profit share.
Currencies38934
Market Cap$ 2.70T-0.82%
24h Spot Volume$ 27.10B+16%
DominanceBTC57.73%+0.20%ETH10.81%-0.82%
ETH Gas1.52 Gwei
BitcoinTechnical AnalysisTradingMarket DataOrder Book Analysis
Aug 31, 2026
3min read
byDhaval
forBitcoin World
See what traders are focused on
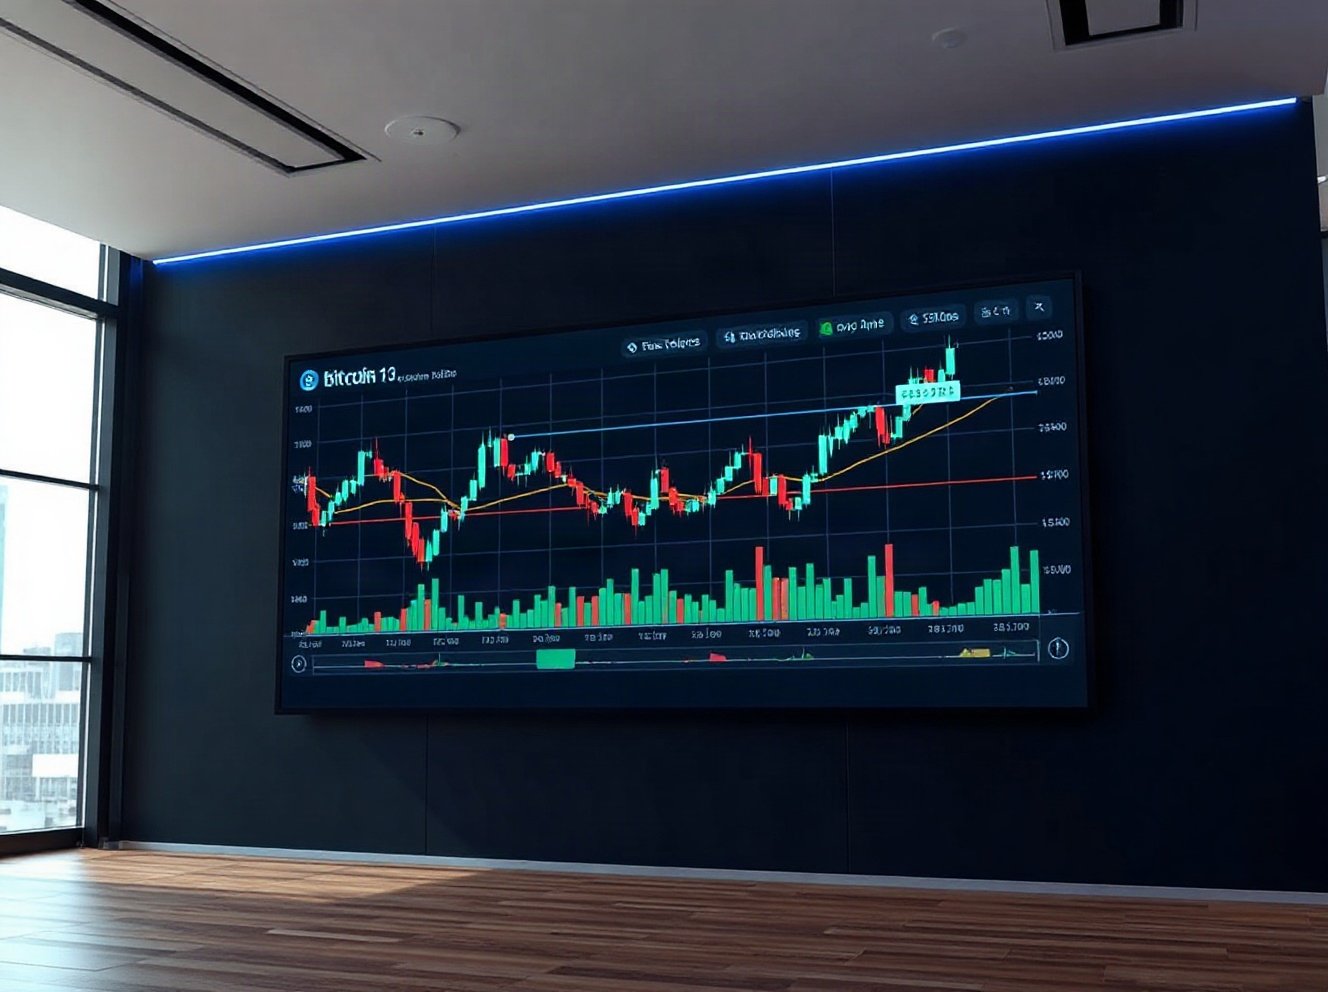
On August 31 at 9 a.m., the BTC/USDT spot trading pair exhibited notable order-book dynamics, as reflected in the spot Cumulative Volume Delta (CVD) chart. This tool, which combines a volume heatmap with cumulative volume delta, offers traders a granular view of buying and selling pressure at various price levels. For market participants, understanding these metrics can provide actionable insights into potential support and resistance zones.
Understanding the Volume Heatmap
The upper section of the chart displays a volume heatmap that tracks trading activity at each price level. The background color intensifies when the price remains within a specific range for an extended period or experiences sharp movements. These brighter zones often act as magnets for price, potentially becoming support or resistance levels. On the Aug. 31 chart, several such clusters are visible, indicating areas where significant trading has occurred. Traders often watch these zones for potential breakouts or reversals.
Cumulative Volume Delta: A Closer Look
The lower section of the chart presents the cumulative volume delta (CVD), which reflects the net difference between buy and sell orders, segmented by order size. The yellow line represents orders between $100 and $1,000, while the brown line tracks large orders between $1 million and $10 million. Other categories are also included, offering a multi-tiered view of market participation. As buy orders increase, the corresponding line moves higher, indicating bullish sentiment. On Aug. 31, the divergence between small and large order flows could signal <a href="https://xpertsstudio.com/solana-breaks-10-month-curse-as-institutional-money-storms-in/” title=”Solana Breaks 10-Month Curse as Institutional Money Storms In”>institutional positioning versus retail activity.
Why This Matters for Traders
For traders, the CVD chart is not just a technical tool but a window into market microstructure. By analyzing the cumulative volume delta alongside the volume heatmap, one can gauge whether price movements are supported by genuine volume or merely noise. This is particularly relevant in Bitcoin’s volatile market, where large orders can create sudden spikes or drops. The data from Aug. 31 suggests that while retail orders (yellow line) were relatively stable, large orders (brown line) showed more pronounced fluctuations, potentially indicating institutional activity. Such insights can help traders make more informed decisions, whether they are day trading or managing longer-term positions.
Conclusion
The BTC spot CVD chart from Aug. 31 provides a snapshot of market sentiment at a specific moment. While it is not a predictive tool, it offers valuable context for understanding price dynamics. Traders should combine this data with other indicators and market news to build a comprehensive strategy. As always, past performance is not indicative of future results, and market conditions can change rapidly.
Q1: What is a spot CVD chart?
A spot CVD chart displays cumulative volume delta, which measures the net difference between buy and sell orders over time, for a specific trading pair like BTC/USDT. It helps traders assess buying and selling pressure.
Q2: How does the volume heatmap work?
The volume heatmap shows trading volume at each price level, with brighter colors indicating higher activity. These areas often act as support or resistance levels.
Q3: What do the different colored lines in the CVD section mean?
The lines represent cumulative volume delta for different order sizes. For example, the yellow line tracks orders between $100 and $1,000, while the brown line tracks orders between $1 million and $10 million, offering insights into retail versus institutional activity.
Source: cryptorank.io
1 Comment
Pingback: XRP Price Prediction: Top Analyst Confirms Breakout | News – xpertsstudio