


Don't want to trade it yourself?
Our desk runs DEX portfolios on profit share.
Markets are chasing a violent short squeeze as traders rush to reposition. Bitcoin price today sits at $79,002.41, just under the $80,000 line that has dominated headlines. The move is less about steady accumulation and more about forced unwinds.
Key takeaways
- Bitcoin trades at $79,002.41 on August 26, 2026, just below the $80,000 level.
- Daily RSI14 reads 80.55, which is deep in overbought territory.
- Fortune reports that traders positioned for bitcoin to stay below $67,000 were squeezed out after a Treasury buyback.
- Fear & Greed Index sits at 65, while Bitcoin dominance is 59.25% of a roughly $2.665 trillion market.
- Daily pivot support sits at $78,459.07, with R1 resistance at $79,398.67.
What Is Driving the Rally: Trend Strength vs. Overextension
The rally is driven by a short squeeze combined with building ETF demand, but the daily chart is now deeply overbought. The round number has dominated headlines all week. However, the mechanics matter more than the number itself. Bloomberg reported $BTC touching a three-month high of $80,000 as momentum returns, and CNBC flagged the biggest three-day rally since 2023.
According to Fortune, traders positioned for bitcoin to stay stuck below $67,000 got that trade blown up in a single afternoon. A Treasury buyback triggered the short squeeze. That said, this reframes the rally as forced unwinds ripping through a crowded short base rather than steady accumulation. Layer on Bloomberg’s note about ETF inflows building toward $80,000, and institutional demand and short-covering are reinforcing each other, at least for now.
That tension defines Bitcoin price today: capital is concentrating into $BTC while altcoins bleed. Bitcoin’s dominance stands at 59.25% of a roughly $2.665 trillion total crypto market cap. That total fell 4.28% over 24 hours even as $BTC pushed higher. This is a selective risk-on move, not a market-wide euphoria wave. The Fear & Greed Index reading of 65 (‘Greed’) backs that up: sentiment is warm, not yet at extreme levels.
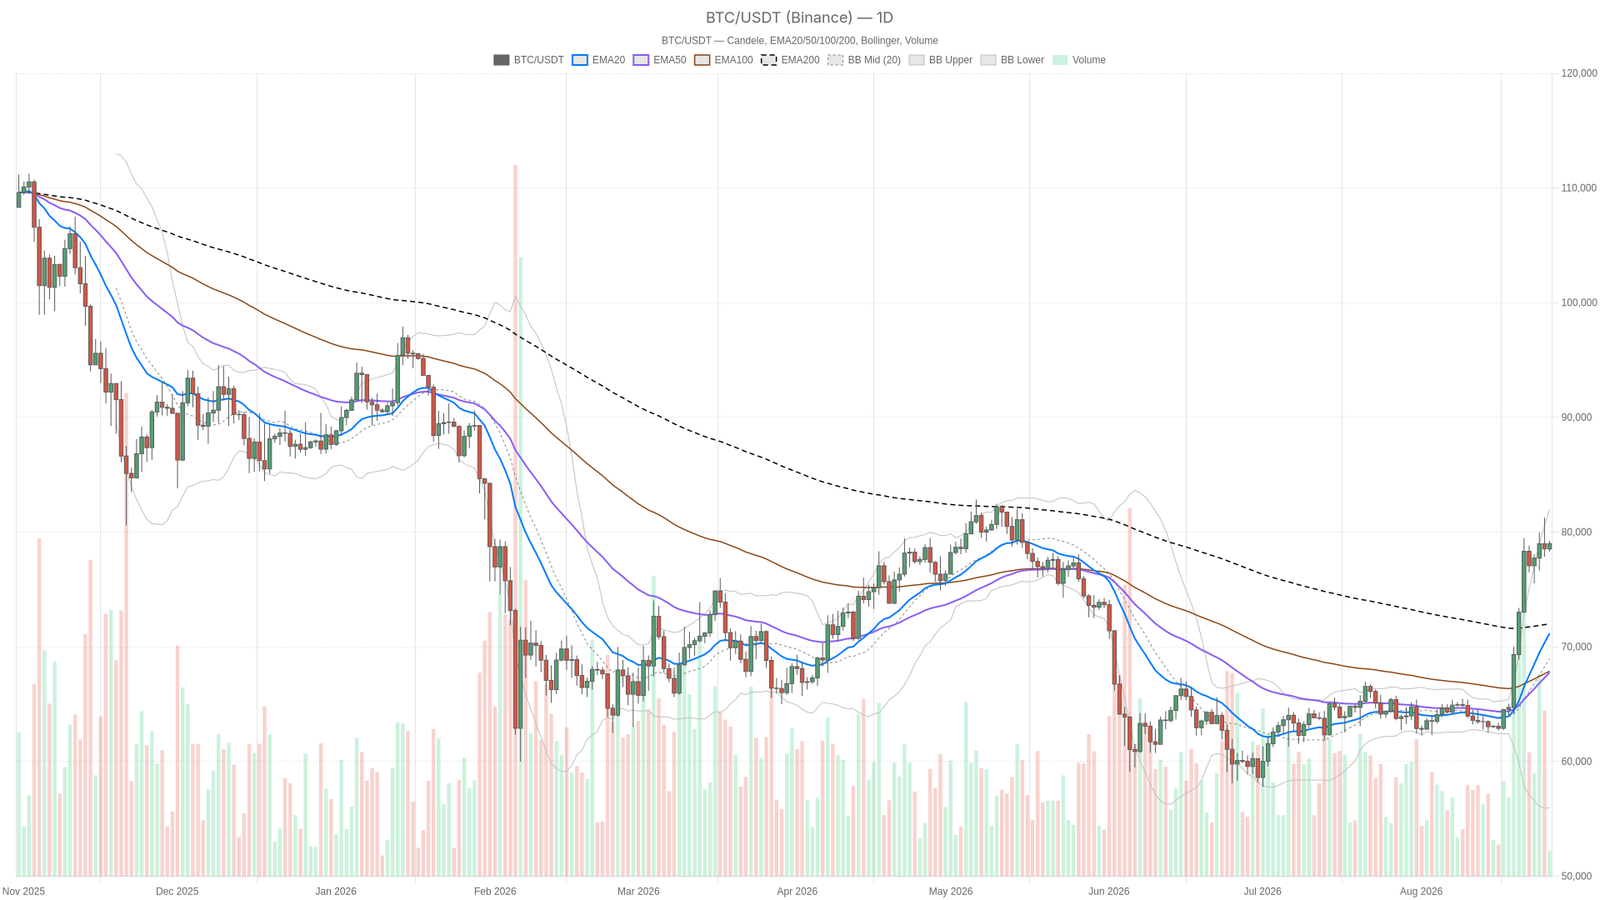
The daily timeframe defines the macro bias, and it is unambiguously bullish in structure. Price at $79,002 is trading well above the EMA20 at 71,181.5, the EMA50 at 67,763.13, and the EMA200 at 72,010.62. That is a stacked, orderly bullish arrangement where short-term momentum has overtaken longer-term averages. However, the problem is speed: RSI14 on the daily sits at 80.55, deep in overbought territory. That does not kill the trend, but it means the move has burned through a lot of short-term fuel.
MACD on the daily supports the bullish read for now. The line at 3920.72 sits well above the signal at 2507.83, with a histogram of +1412.88 showing expanding momentum. There is no bearish divergence yet, which suggests the squeeze still has genuine thrust. The Bollinger Bands reinforce that: price is hugging the upper band at 81,996.6 against a mid-line of 68,982.83 and a lower band of 55,969.06. That is classic trend-riding behavior, not a mean-reversion setup. ATR14 at 2532.5 confirms daily ranges have expanded sharply, so volatility is elevated.
The daily pivot cluster puts price right above the pivot. The PP sits at $78,855.34, R1 at $79,398.67, and S1 at $78,459.07. R1 is therefore the next real test for buyers.
Hourly and 15-Minute Structure: Confirmation With a Catch
The lower timeframes confirm the bullish bias, yet they show a market that is consolidating rather than pushing higher. The H1 chart strips out the daily chart’s overheated urgency. RSI14 here reads a neutral 50.24, so the overbought heat from the daily has essentially reset. That is typical after a sharp squeeze: the higher timeframe carries the trend while the lower timeframe catches its breath.
The hourly EMAs are essentially flat against price. EMA20 sits at 78,987.13 and EMA50 at 78,763.64, while EMA200 sits well below at 74,712.32. The broader hourly trend is still intact. MACD is barely positive: the line reads -37.63 against a signal of -44.82, with a histogram of +7.19. That is a tentative bullish cross rather than a strong signal, consistent with a market pausing rather than pushing.
Bollinger Bands on H1 point to genuine consolidation after the squeeze. The mid-line sits at 78,926.33, with the upper band at 79,508.85 and the lower band at 78,343.81. A comparatively small ATR14 of 468.16 confirms that the market is digesting rather than immediately continuing.
The 15-minute chart is only useful for execution context here. It shows tightly bunched EMAs at 78,963, 78,954, and 78,802, with RSI at 52.49 and a slightly negative MACD histogram of -10.38. That is a minor pullback inside the range, nothing structural. Meanwhile, with ATR14 down to 196.14, this is a market compressing before its next decision. Buyers are likely defending the S1/pivot zone near 78,929–78,971, while sellers cap moves near R1 at 79,041.
Bullish and Bearish Scenarios for Bitcoin
The bullish case targets a move above $80,000, while the bearish case leans on an overbought daily RSI of 80.55. The bullish case is straightforward. If bitcoin clears the daily R1 at $79,398.67 with real follow-through, and that level holds on hourly pullbacks, the stacked EMA structure argues for continuation. The target would be the $80,000 area, with the upper daily Bollinger Band near $81,996 as the next magnet. That scenario needs the ETF inflows to keep showing up as sustained demand rather than a one-off week.
However, the bullish case gets invalidated if price fails repeatedly at R1 or slips back below the daily EMA20 near $71,181. That would signal the squeeze ran out of fresh buyers rather than converting into an organic trend.
The bearish, mean-reversion case leans on that daily RSI reading of 80.55. It is stretched enough that a pullback toward the Bollinger mid-line at 68,982.83, or even the EMA50 at 67,763.13, is a real possibility. Much of this rally traces back to short covering rather than fresh accumulation. Moreover, the total crypto market cap fell 4.28% even as $BTC rallied, which hints at thin, rotational liquidity rather than a broad risk-on wave.
If price loses the daily pivot support at $78,459.07 and the H1 MACD histogram flips negative, a deeper retracement toward the EMA50 becomes the working scenario. Still, the bearish case gets invalidated if bitcoin instead reclaims and holds above the daily pivot at $78,855.34. That would require RSI to cool gradually into the 60s rather than break down.
Positioning and Risk
Positioning is stretched on the daily chart but neutral on the hourly, which argues for patience around the pivot band. The tape is telling two slightly different stories depending on where you look, and that is worth respecting. The daily chart says this is a strong, overextended uptrend that earned its stripes through a violent short squeeze and supportive ETF flow data.
The hourly and 15-minute charts say the market is resting, digesting those gains in a tight range without much conviction either way. Volatility, measured by ATR, has expanded meaningfully on the daily, so whatever comes next is likely to move fast. Meanwhile, with Fear & Greed sitting at 65 and dominance concentrated in Bitcoin, the broader market cap is still contracting. This looks like a selective, momentum-driven phase rather than a stable, broad-based rally.
The next few sessions are the real test. How price behaves around the $78,459–$79,399 pivot band will say more about what happens next than any single indicator on its own.
Why did bitcoin rally so quickly?
Bloomberg reported $BTC touching a three-month high of $80,000, and CNBC flagged the biggest three-day rally since 2023. Fortune attributed the move to a violent short squeeze after a Treasury buyback, which blew up trades positioned for bitcoin to stay below $67,000.
Is bitcoin overbought right now?
The daily RSI14 reads 80.55, which is deep in overbought territory. The hourly RSI14, however, has reset to a neutral 50.24, suggesting the lower timeframe is consolidating after the squeeze.
What levels should traders watch?
The daily pivot sits at $78,855.34, with support at $78,459.07 and resistance at $79,398.67. Above that, the $80,000 area and the upper daily Bollinger Band near $81,996 are the next magnets.
Where could bitcoin pull back to?
If the daily pivot at $78,459.07 fails, a retracement toward the Bollinger mid-line at $68,982.83 or the EMA50 at $67,763.13 becomes possible.
Disclaimer: This article is for informational purposes only and does not constitute financial advice, an investment recommendation, or a solicitation to buy or sell any financial instrument or cryptocurrency. The analysis provided is not indicative of future results. Investing in crypto assets and financial markets carries a high risk of capital loss. Always do your own research (DYOR) and consult a qualified financial advisor before making any decision.
Article produced with the assistance of artificial intelligence and reviewed by the editorial team.
Source: cryptonews.net
1 Comment
Pingback: Bitcoin Price Prediction: Arthur Hayes Says Bull Market Has Begun | Bitcoin Market – xpertsstudio