


Don't want to trade it yourself?
Our desk runs DEX portfolios on profit share.
A rare Bitcoin ($BTC) bull market signal has emerged after the cryptocurrency posted one of its strongest weekly gains in recent years, raising speculation that a new market cycle may already be underway.
The analysis comes after Bitcoin surged from around $62,700 to $79,500 in a single week, delivering a gain of more than 20%.
The move mirrors powerful reversal candles seen at major market turning points in previous cycles, including 2019 and 2023.
According to historical analysis shared by market analyst Ali Martinez in an X post on August 22, similar explosive weekly candles have appeared near the end of Bitcoin bear markets and the beginning of new bullish phases.
Martinez noted that the latest rally resembles Bitcoin’s 2019 recovery, when the asset recorded a 31.98% weekly gain after an extended bear market. That move helped establish a new uptrend and marked the end of prolonged selling pressure.
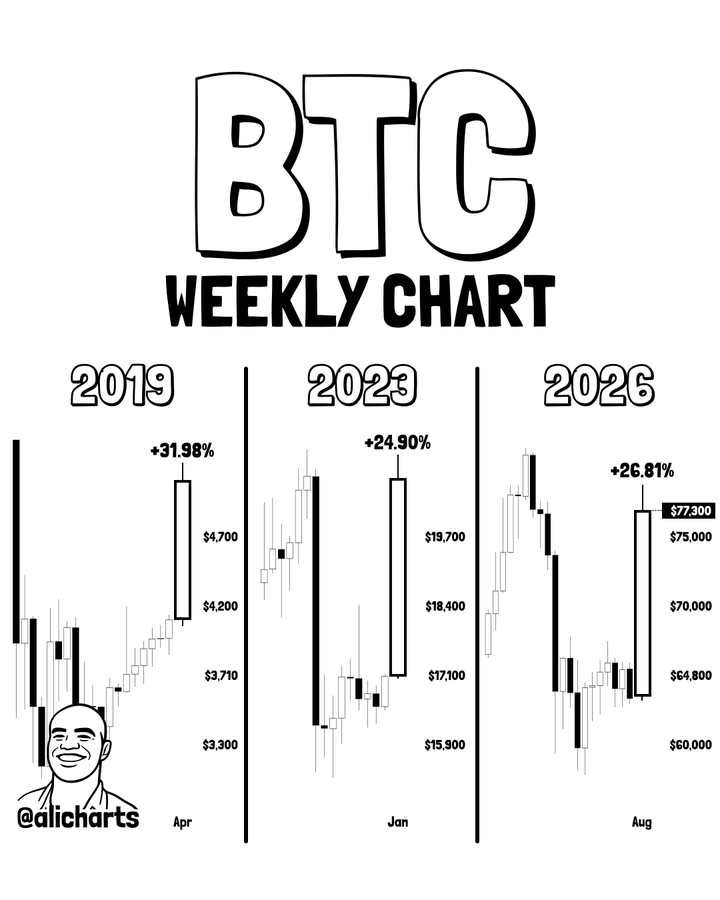
A comparable pattern emerged in January 2023 following the collapse of FTX. At the time, market sentiment remained heavily bearish, yet Bitcoin advanced 24.90% in a single week, triggering a sharp trend reversal and laying the foundation for the next phase of the market recovery.
The current weekly candle ranks alongside those historic moves, making it one of the strongest advances of the current cycle.
Notably, large weekly reversal candles often emerge during short squeezes, as rising prices force bearish traders to close positions, adding momentum to the rally.
The latest surge caught many investors off guard, as expectations were centered on a deeper correction and a later-cycle bottom.
While a single indicator cannot confirm a new bull market, similar weekly candles have historically appeared near major Bitcoin market turning points.
Bitcoin’s MACD indicator signal
Additional technical evidence comes from the two-week MACD chart shared by crypto analyst Moustache on August 22. The indicator is nearing a bullish crossover, a signal that occurs when the MACD line rises above its signal line and momentum shifts upward.
The analysis highlighted similar crossovers near major Bitcoin bottoms in 2015, 2018, and 2022. Each of those signals was followed by substantial upside moves and the start of new bullish phases.
The latest setup is developing near what the analyst identified as the 2026 market bottom, suggesting Bitcoin may be repeating a familiar cycle structure. Historical analysis of the two-week MACD has also shown that previous bullish crossovers coincided with the beginning of major Bitcoin rallies.
Bitcoin price analysis
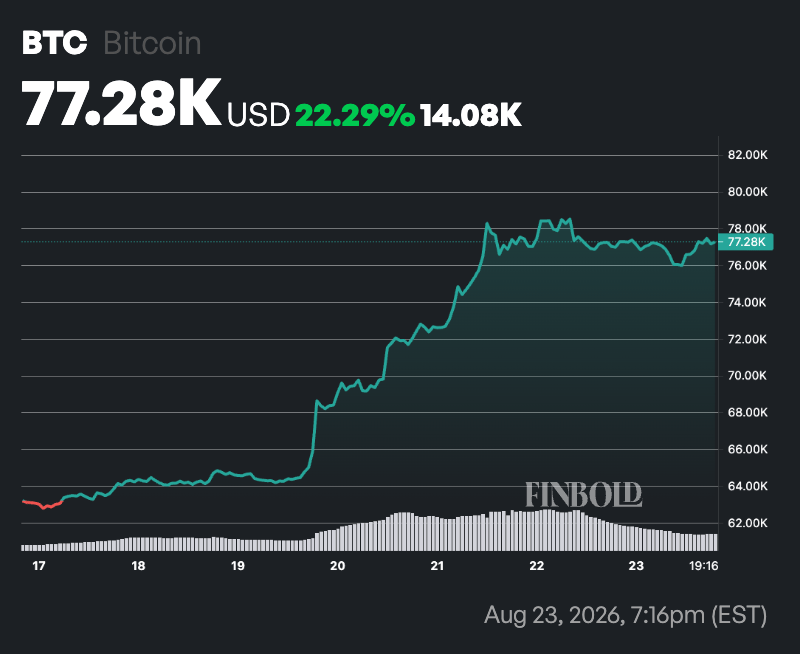
At the current price, Bitcoin is trading comfortably above its 50-day simple moving average (SMA) of $64,616 and 200-day SMA of $69,010, indicating a strong bullish trend.
The fact that the cryptocurrency remains above both key moving averages suggests buyers are firmly in control and the broader market structure remains positive.
However, the 14-day relative strength index (RSI) stands at 85.99, placing Bitcoin deep in overbought territory.
While this reflects exceptionally strong momentum following the recent rally, it also suggests the asset may be due for a period of consolidation or a short-term pullback as traders take profits.
Source: cryptonews.net
2 Comments
Pingback: RWA Value Crosses $4 Billion – xpertsstudio
Pingback: Bitcoin survives a $500M flush – xpertsstudio