


Don't want to trade it yourself?
Our desk runs DEX portfolios on profit share.
Bitcoin Price Today: $77,971 as Bullish Structure Meets Fading Momentum
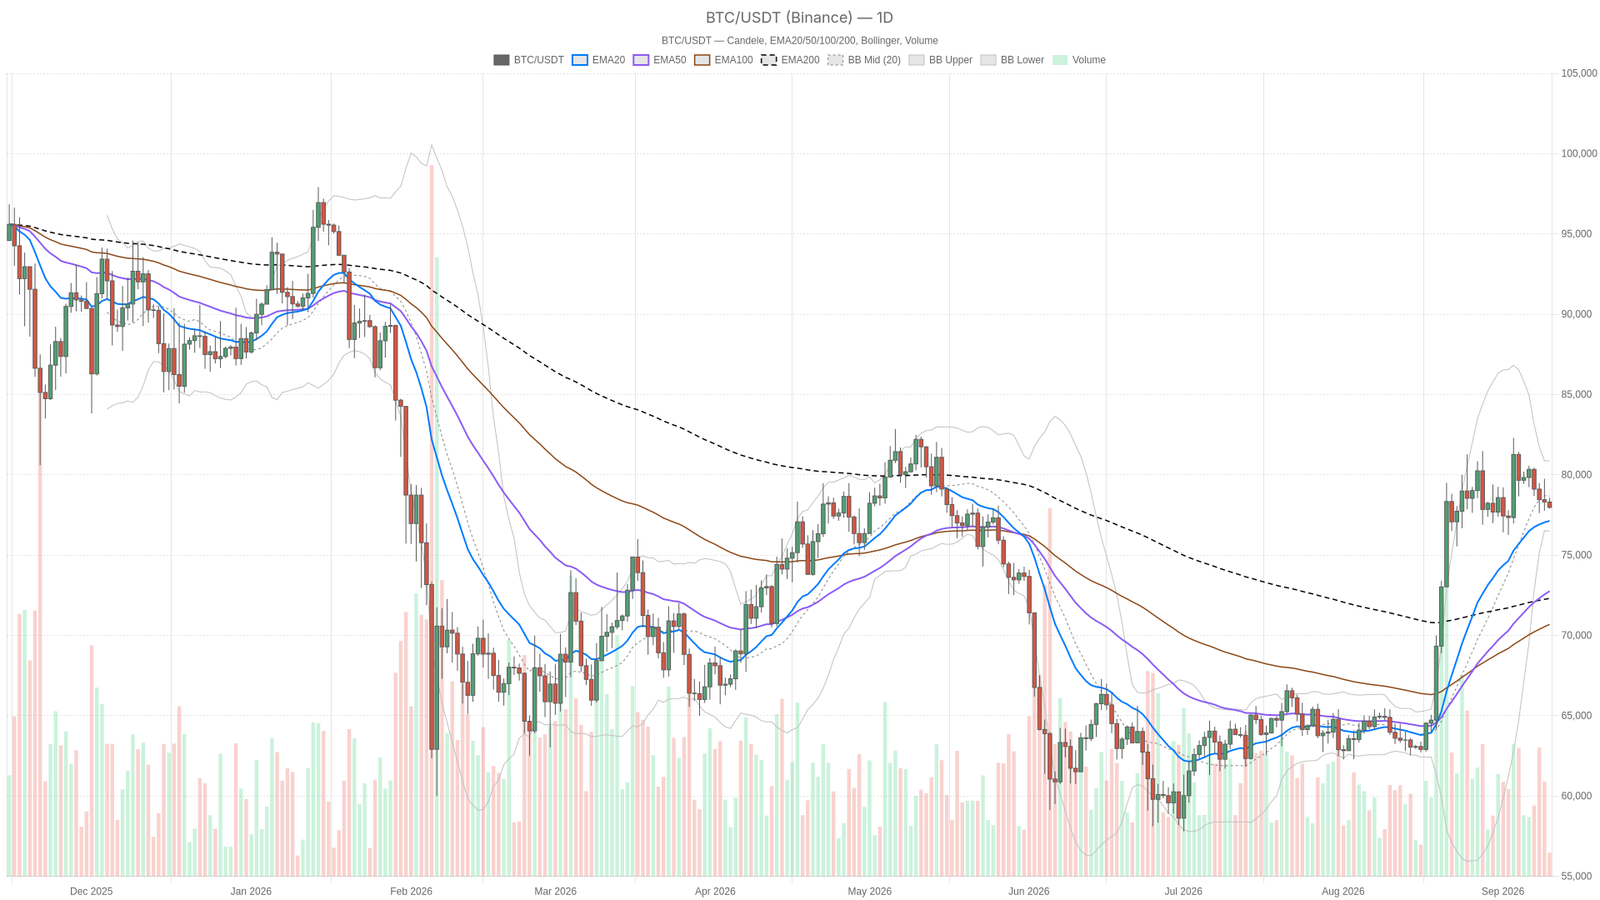
As of September 10, 2026, the Bitcoin price today sits at $77,971 on the daily chart — caught between an uptrend structure and weakening short-term momentum. The broader crypto market shed 4.27% in 24 hours, yet Bitcoin dominance climbed to 58.57%, signaling capital rotation toward the largest digital asset.
Key takeaways
- Bitcoin trades at $77,971 on September 10, 2026, remaining above its daily EMA20, EMA50, and EMA200 in a clean ascending stack.
- The daily MACD has produced a bearish crossover with a histogram of -585.5, signaling that recent rally momentum is fading.
- Hourly and 15-minute charts both display fully bearish EMA stacks, with RSI readings below 41 and price testing lower Bollinger Bands.
- The Fear & Greed Index remains at 69 (Greed) despite a 4.27% total market capitalization decline, creating a sentiment disconnect.
- Bitcoin dominance rose to 58.57%, indicating capital rotation from altcoins into $BTC rather than broad-based immunity to selling.
Bitcoin Price Today: A Tug-of-War Between Trend and Momentum
The daily chart structure remains technically bullish, with price above all three major EMAs — but momentum indicators have begun rolling over. Price at $77,971 trades above the EMA20 ($77,130), well above the EMA50 ($72,759), and well above the EMA200 ($72,302). That ascending EMA stack defines a market still in an uptrend on the higher timeframe, regardless of what is happening this week. RSI14 at 58.09 backs that up without overstating it: comfortably bullish territory but nowhere near overbought, leaving room for movement in either direction without immediate exhaustion risk.
However, the MACD tells a more cautious story. The line sits at 2373.91, still positive, but it is now below the signal line at 2959.41, producing a histogram of -585.5. That is a daily momentum crossover to the downside unfolding inside a still-bullish trend. In plain terms, the rally that built the current structure is losing steam even though the structure itself has not broken. Meanwhile, the Bollinger Bands add context: price sits below the daily mid-band (78,684) and closer to the lower band (76,491) than the upper one (80,877), confirming this is a pullback from recent strength rather than a market pinned against resistance.
CNBC recently reported Bitcoin was heading for a third winning week, while Fortune described the Bitcoin price today as trading ‘more like an amplified version of gold again’ — yet also flagged that four-year cycle theory points to downside risk ahead. Those two narratives capture exactly what the technicals are showing: a market that wants to be both a macro hedge and a bull trend simultaneously, with those identities now pulling in opposite directions. The daily pivot cluster — PP at 78,147.44, R1 at 78,388.41, S1 at 77,730.50 — currently has price trapped just under the pivot point, which on its own is a mildly defensive, wait-and-see signal for the next 24 hours.
The Hourly and 15-Minute Picture: Where the Selling Is Actually Showing Up
The hourly and 15-minute charts both display a fully bearish alignment across all major indicators, confirming that sellers control the intraday tape. On the 1H chart, price at $77,974.89 trades below its EMA20 (78,433.53), EMA50 (78,673.11), and EMA200 (78,904.07) — a bearish EMA stack that mirrors the daily structure in reverse. RSI14 has dropped to 40.32, and while that is not oversold, it confirms buyers have lost control of the intraday tape. The MACD here is negative (-155.4 line vs -148.21 signal, histogram -7.19), but the small histogram size suggests the bearish push is more of a grind than an accelerating breakdown.
Moreover, the 15-minute chart sharpens that picture further. EMA20 (78,264.68), EMA50 (78,346.14), and EMA200 (78,677.68) are all stacked above current price with the same bearish alignment, but the momentum reading is more dramatic: RSI14 at 38.05 and a MACD histogram of -43.03 point to a fresh, decisive short-term move down rather than a slow bleed. Price ($77,974.89) is actually trading below the lower Bollinger Band (78,051.97) on this timeframe — a short-term overextension that either keeps stretching on fresh selling pressure or snaps back sharply once sellers are exhausted. The 15m pivot (PP 77,976.07) sits essentially right on top of current price, meaning the market is at a genuine short-term equilibrium point even as the broader hourly trend leans down.
Bullish Scenario
Buyers need to reclaim the hourly EMA20 near 78,433 and push back through the daily pivot at 78,147.44 to convert this pullback into a healthy correction within the uptrend. If that happens with the daily RSI holding above 50 and the MACD histogram starting to shrink rather than widen, this starts to look like a normal, healthy pullback inside the larger uptrend rather than a top. Given price remains structurally well above the daily EMA50 and EMA200, there is real room for a bounce toward the daily Bollinger mid-band at 78,684 and, if momentum genuinely turns, the upper band near 80,877. That said, this scenario gets invalidated if price cannot reclaim the daily EMA20 (77,130) and instead keeps losing ground toward the daily S1 (77,730) and eventually the lower Bollinger Band at 76,491.
Bearish Scenario
With both the 1H and 15m timeframes already bearish across every major measure — EMA stack, RSI, and MACD all agree — the case for more downside rests on a rare moment of alignment on the shorter frames. If sellers push through the daily S1 at 77,730.50, the next logical magnet is the daily lower Bollinger Band around 76,491, especially with the broader market still digesting a 4.27% 24-hour drop in total capitalization and the kind of macro unease Fortune tied to four-year cycle theory. However, what would break this bearish case is a move back below the daily EMA50 at 72,759 — until that level is actually threatened, this reads as a correction within an intact uptrend, not the start of a new downtrend. Any bounce off S1 or the lower band that reclaims the hourly EMA20 would put the bearish thesis on hold quickly.
Positioning, Risk, and What This Setup Really Means
This is a market where the daily trend and intraday momentum disagree, and that disagreement defines the entire risk profile. The Fear & Greed Index reads 69, still in Greed territory, despite the market having just shed over 4% of its total value in a day. That disconnect is worth sitting with: it can mean traders are treating this drop as a buy-the-dip opportunity inside a trend they still trust, or it can mean sentiment simply has not yet caught up to what price action is already showing on the lower timeframes. Neither reading is free of risk.
Furthermore, Bitcoin price today is not broken, but it also is not cleanly bullish in the way the daily EMA stack alone would suggest. The hourly and 15-minute readings are flashing real short-term weakness, and the fact that price has already pushed below the 15-minute lower Bollinger Band suggests volatility is picking up, not settling down. Daily ATR of roughly 2,185 points and the tight pivot clusters on the lower timeframes both point to a market that can move fast in either direction from here. With dominance rising, a broad risk-off tape, and sentiment still reading greedy, the next few sessions carry more uncertainty than the daily chart alone lets on.
What is the Bitcoin price today and what does the daily chart suggest?
As of September 10, 2026, Bitcoin trades at $77,971. The daily chart maintains a structurally bullish posture with price above the EMA20 ($77,130), EMA50 ($72,759), and EMA200 ($72,302). However, the MACD has produced a bearish crossover (histogram -585.5), indicating that rally momentum is weakening even though the uptrend structure remains intact.
Is the short-term momentum bearish for Bitcoin?
Yes, on the lower timeframes. The 1H chart shows price below all three major EMAs with RSI at 40.32, while the 15-minute chart shows an even more pronounced bearish alignment with RSI at 38.05 and price trading below the lower Bollinger Band. Both timeframes agree on a bearish short-term posture, though the hourly MACD histogram (-7.19) suggests the move is a grind rather than an accelerating sell-off.
What are the key support levels to watch for Bitcoin?
The immediate support is the daily S1 pivot at 77,730.50, followed by the daily lower Bollinger Band near 76,491. A more structurally significant level sits at the daily EMA50 ($72,759) — a break below that would shift the narrative from a correction within an uptrend to something more serious.
What does the Fear & Greed Index indicate about current market sentiment?
The Fear & Greed Index stands at 69, firmly in Greed territory, despite the broader crypto market having lost 4.27% of its total capitalization in a single day. This disconnect suggests traders may be viewing the dip as a buying opportunity, though it also carries the risk that sentiment has not yet caught up with the short-term weakness visible on lower timeframes.
Disclaimer: This article is for informational purposes only and does not constitute financial advice, an investment recommendation, or a solicitation to buy or sell any financial instrument or cryptocurrency. The analysis provided is not indicative of future results. Investing in crypto assets and financial markets carries a high risk of capital loss. Always do your own research (DYOR) and consult a qualified financial advisor before making any decision.
Article produced with the assistance of artificial intelligence and reviewed by the editorial team.
Source: cryptonews.net