


Don't want to trade it yourself?
Our desk runs DEX portfolios on profit share.
Currencies38994
Market Cap$ 2.70T-0.20%
24h Spot Volume$ 33.96B-0.97%
DominanceBTC57.45%-0.21%ETH10.81%-0.38%
ETH Gas0.16 Gwei
MarketAltcoinUniswapUNI
Sep 2, 2026
2min read
bySarayu Krishna
forTheNewsCrypto
<img src="https://xpertsstudio.com/wp-content/uploads/2026/09/Will-Uniswap-UNI-Find-Its-Momentum-Again.jpg" alt="10% Pump for Uniswap (UNI): Can It Hold Above Resistance?” loading=”lazy”>
Uniswap’s UNI jumped about 10% to trade near $6.31, rising 47% over the past week and 54% month-to-date with daily volume around $1.15 billion and $3.75 million in 24h liquidations, marking strong token performance in the DeFi/DEX market. Technicals show MACD above the signal and an RSI near 74.86, indicating bullish momentum but heightened pullback risk; key resistance sits at $6.39–$6.79 while supports lie at $6.23, $6.10 and $5.97–$5.70.
See what traders are focused on
- After a 10% jump, Uniswap’s price is trading at $6.
- UNI’s indicators exhibit a healthy macro uptrend.
The broader crypto market is barely moving, making a potential move lag. Among the digital assets, Uniswap (UNI) enters September under bullish pressure. With buyers maintaining full control of its trajectory, the asset has surged 47% over the past 7 days, extending its monthly gains to 54%.
Notably, the bulls have stuck to the charts, blocking the entry of a downside trading pattern. The technical structure remains firmly positive, as it trades within a well-established uptrend. The bullish price alignment confirms that buyers continue to dominate the broader market trend of UNI.
As per CoinGecko reporting, Uniswap has posted a 10.8% rise in value and is currently trading within the $6.31 range. The price is holding above the daily low noted at $5.58, and below the daily high of $6.37. Moreover, the daily volume has reached $1.15 billion. In the last 24 hours, the UNI market has seen $3.75 million in liquidations.
Uniswap’s Key Price Levels to Watch
The short-term price structure depends on a few important upcoming levels. As the bulls are active, the immediate resistance might be at $6.39, followed by a range above $6.50. A sturdy upper zone of UNI observed between $6.57-$6.79 is crucial and will decide whether it stabilises or continues to climb.
On the other hand, a bearish reversal could place the initial support level at around $6.23. The price would slip through $6.10 if the negative momentum intensifies, and likely confirm that sellers are gaining control. With the next levels sitting near $5.97-5.70, the lower targets are aimed to be broken.
UNI Technicals Point to Further Upside
The four-hour chart of Uniswap reveals that the Moving Average Convergence Divergence (MACD) line has crossed above the signal line. With both lines trading above zero, there is strong bullish momentum. It also confirms a healthy macro uptrend.
The buying momentum is actively accelerating, and traders view this combination as a high-conviction signal that the path of least resistance remains up.
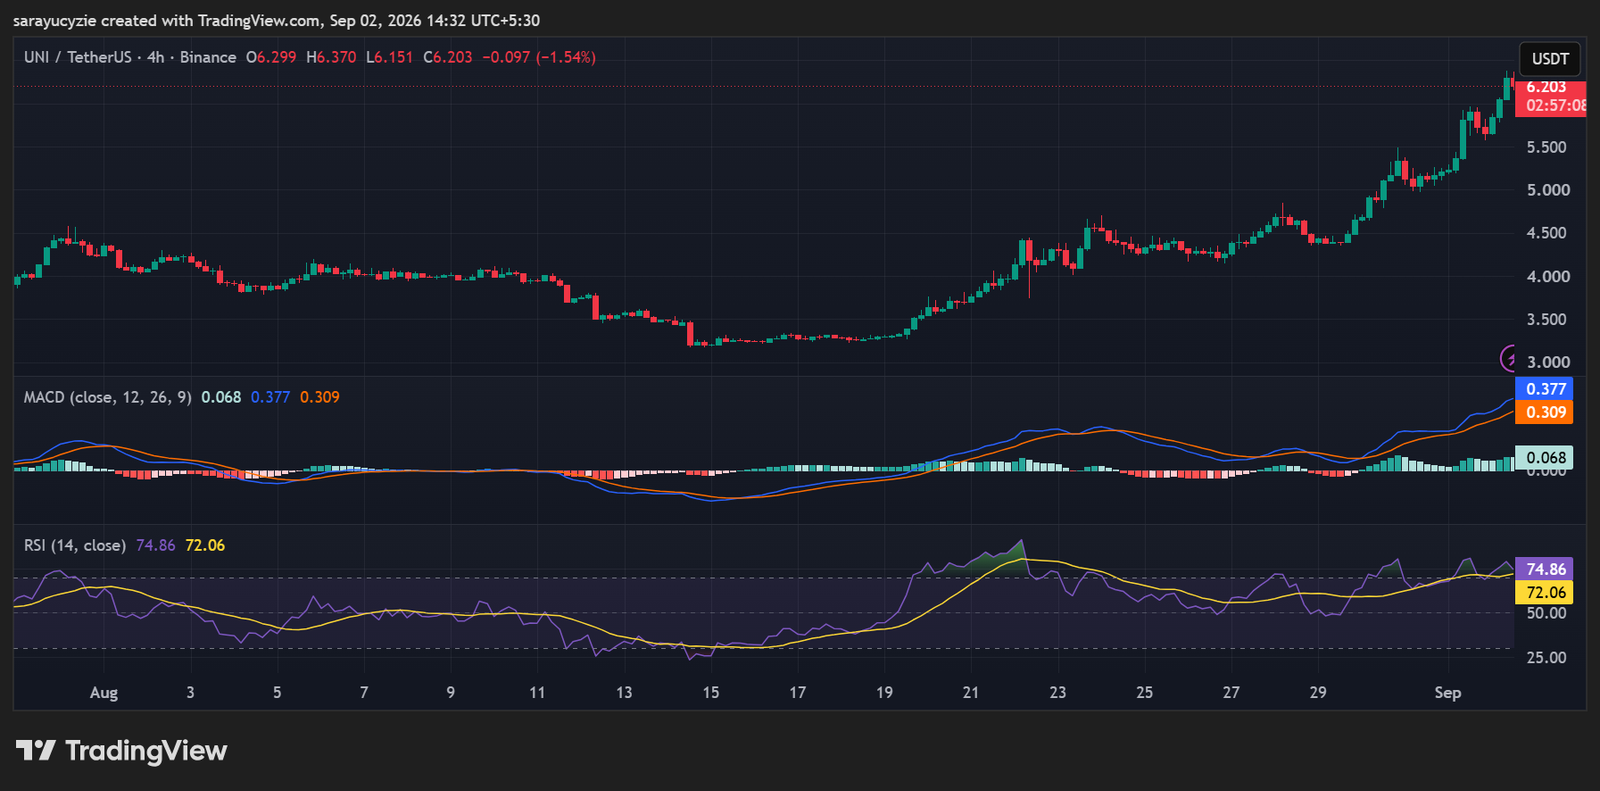
In addition, the daily Relative Strength Index (RSI) value at 74.86 is in overbought territory with a strong uptrend. The buying pressure has been intense. A period of consolidation is increasingly likely, and buyers are in firm control of price action.
Entering new long positions here carries a poorer risk-to-reward ratio due to the heightened pullback risk. It serves as a caution signal for traders to monitor potential short-term pullbacks.
Robinhood and Fomo Face Scrutiny Over KYC-Free Meme Coin Purchases
Source: cryptorank.io