Iran-Israel ceasefire announcement shifted market sentiment from fear (37) to neutral (47), fueling a broad crypto recovery
Crypto majors XRP and ETH jumped above 6% each.
But meme coins SPX6900 and Dogwifhat are showing much more explosive gains, with room to run based on trading data.
The crypto market erupted in a relief rally today as President Donald Trump claimed a full cease fire between Iran and Israel, sparking a general market rebound as global tensions seem to fade.
Oil prices tumbled 2.92% with Brent crude falling to $69.39 as Middle East tensions eased and analysts reject a supply shortage scenario. In the meantime, S&P 500 futures climbed 0.58% to 6,112, and the dollar index dropped 0.32% to 98.10. The risk-on rotation saw gold pull back as safe-haven demand waned. Gold prices dipped 2% to $3,315.8 per oz, with investors pivoting from defensive positions into high-beta crypto plays and riskier assets such as stocks and ETFs.
The cryptocurrency market capitalization increased by 2.9% to $3.23 trillion, with Bitcoin climbing 3.6% to $105,471 and Ethereum jumping 6.5% to $2,422. The broader recovery saw altcoins outperform, with XRP gaining 8.1%, while nearly 30 of the top 100 coins saw double-digit increases with SEI being the top performer, mooning 46.5% to $0.2855.
And, of course, meme coins mooned even harder when these more, er, traditional altcoins spiked.
dMeme coins tend to be volatile and unpredictable, but according to the charts, SPX6900’s explosive 28% rally to $1.3476 comes with compelling technical confirmation. The Average Directional Index also known as ADX at 35 indicates strong trending conditions—readings above 25 confirm established trends, suggesting the current momentum has legs. Traders might interpret this as particularly bullish since it shows the upward movement isn’t just a brief spike but part of a sustained directional move.
The Relative Strength Index or RSI (a thermometer that measures how oversold or overbought an asset is), sits at 56, placing the token in the “power zone” where momentum is strong but not yet overbought. Historical data shows meme coins often run until RSI hits 75-80, suggesting approximately 20% additional upside potential before exhaustion. The 50-day EMA (the average price over the last 50 days) at $1.07 now provides dynamic support, having flipped from resistance during today’s breakout.
Most notably, the Squeeze Momentum Indicator shows “ON” status in a bearish movement, indicating volatility compression that typically precedes explosive moves. When this indicator fires after a period of consolidation, traders often see 30-50% movements in either direction. Combined with today’s volume surge of 96.8%, the setup suggests continuation toward the $1.51 resistance level tested in mid-June.
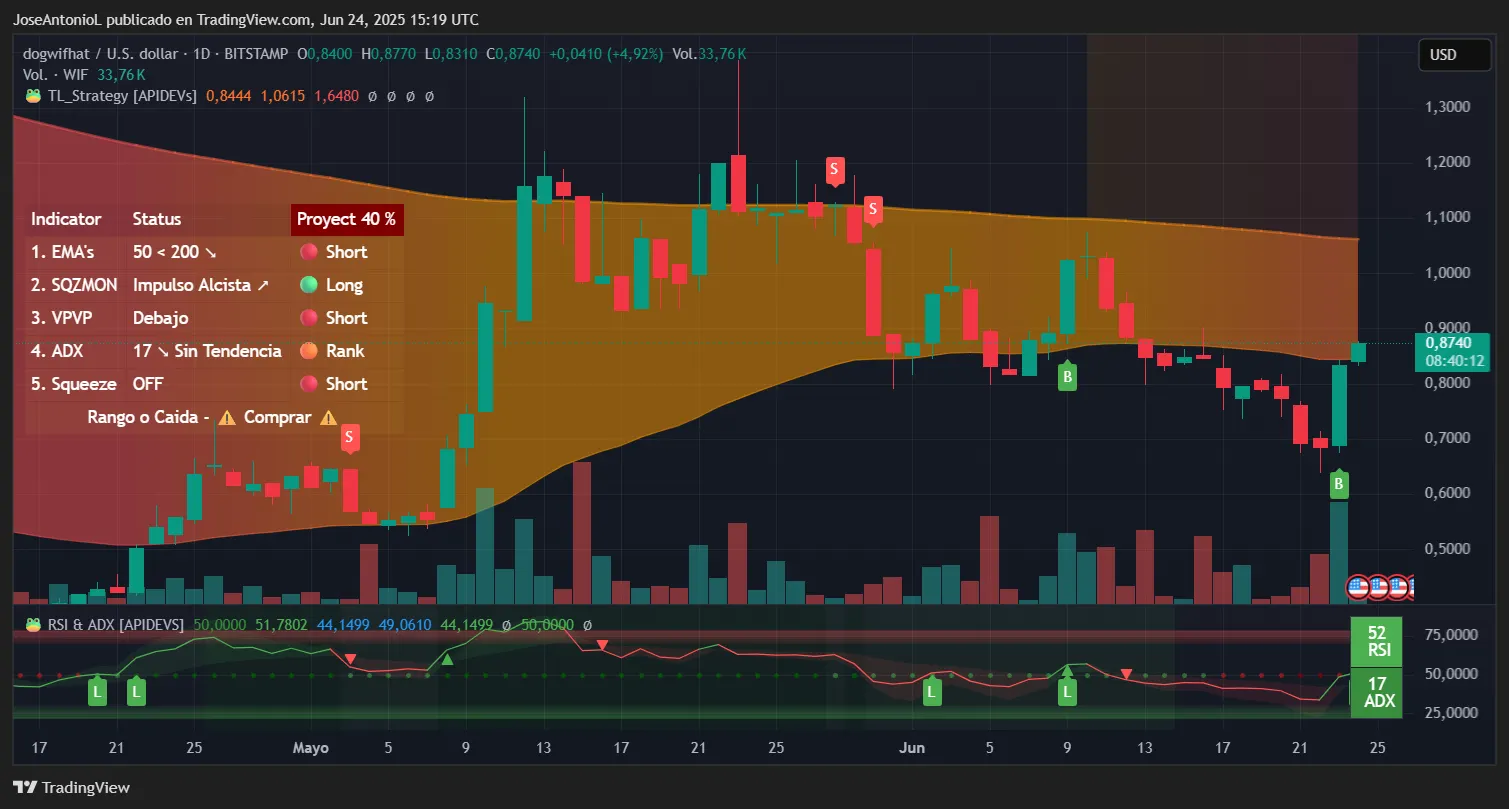
The Dogwifthat meme coin, which trades as WIF, today popped 23% to $0.8740. That’s a win for the WIF traders who study charts, as the token reclaimed the $0.79 level, a former support zone that had capped prices since early June. What’s more, this move triggered $3.71 million in short liquidations. This kind of flip from resistance to support often marks the beginning of sustained uptrends. In other words, it’s a good sign for the spot price of the coin to go back to being higher than the average price over the last 200 days. Perhaps not fully bullish, but still a recovery from the heavy price drop.
The RSI at 52 presents an interesting setup as it’s almost perfectly neutral territory offering maximum flexibility for the next move. Unlike overbought conditions that limit upside, this balanced reading means WIF has room to run if buying pressure continues. The ADX at 17 shows that the bearish trend is now weaker, giving room for a short to medium term bounce if the coin can keep up momentum and this is not just a hype episode.
For traders, the one concerning signal may be the EMA configuration, with the 50-day average below the 200-day in a “death cross” formation since January. However, today’s surge brings price action closer to challenging the 50-day EMA around $0.91. A decisive break above this level would shift medium-term momentum bullish and potentially trigger algorithmic buying from trend-following systems.