

Don't want to trade it yourself?
Our desk runs DEX portfolios on profit share.
Add preferred source
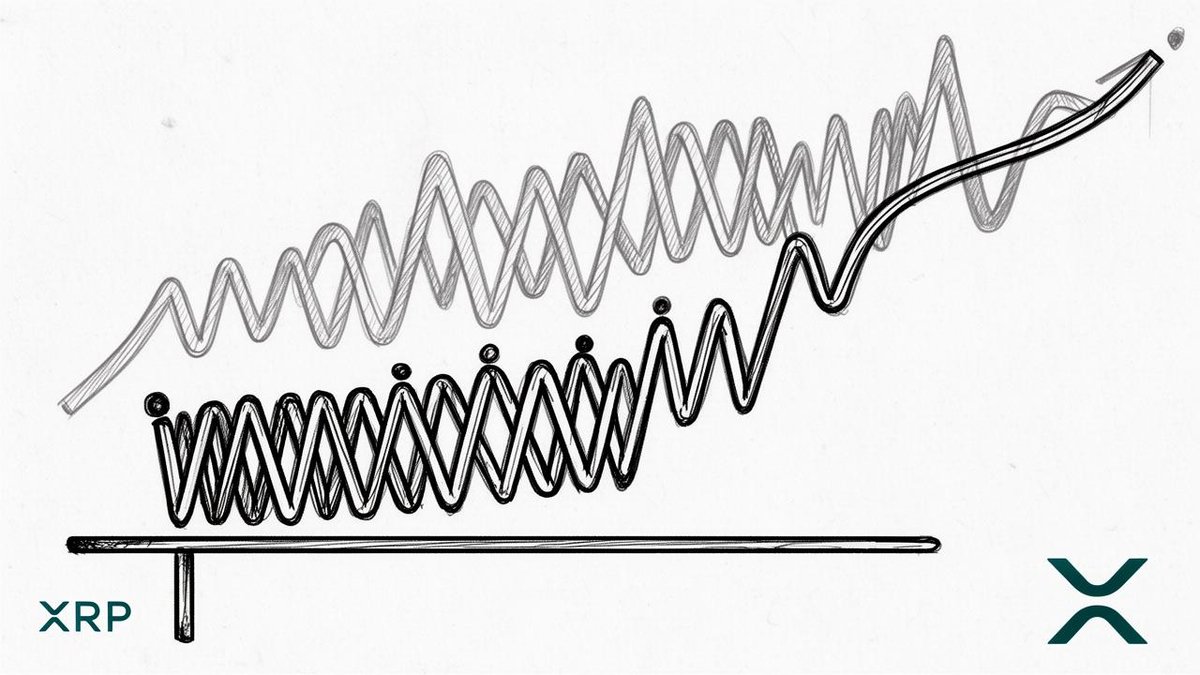
Crypto analyst EGRAG CRYPTO says XRP is repeating a fractal pattern that preceded its sharp rally in late summer. The token is trading near $1.3202, down 0.32%, and sits just above the $1.30 support level highlighted on the analyst’s one-hour chart. The earlier setup involved repeated tests of the $0.97 to $1.05 range from July through mid-August, followed by a breakout that peaked just under $1.69. Four rejection points since then have pulled XRP back toward current levels. Key support zones below $1.30 include $1.1522, $1.1000, $1.0500, and $0.9700, while resistance extends from $1.39 through $1.98. The analyst views the $1.30 threshold as the pivotal level to monitor, with the fractal’s completion likely to define the next directional move.
Key Elements
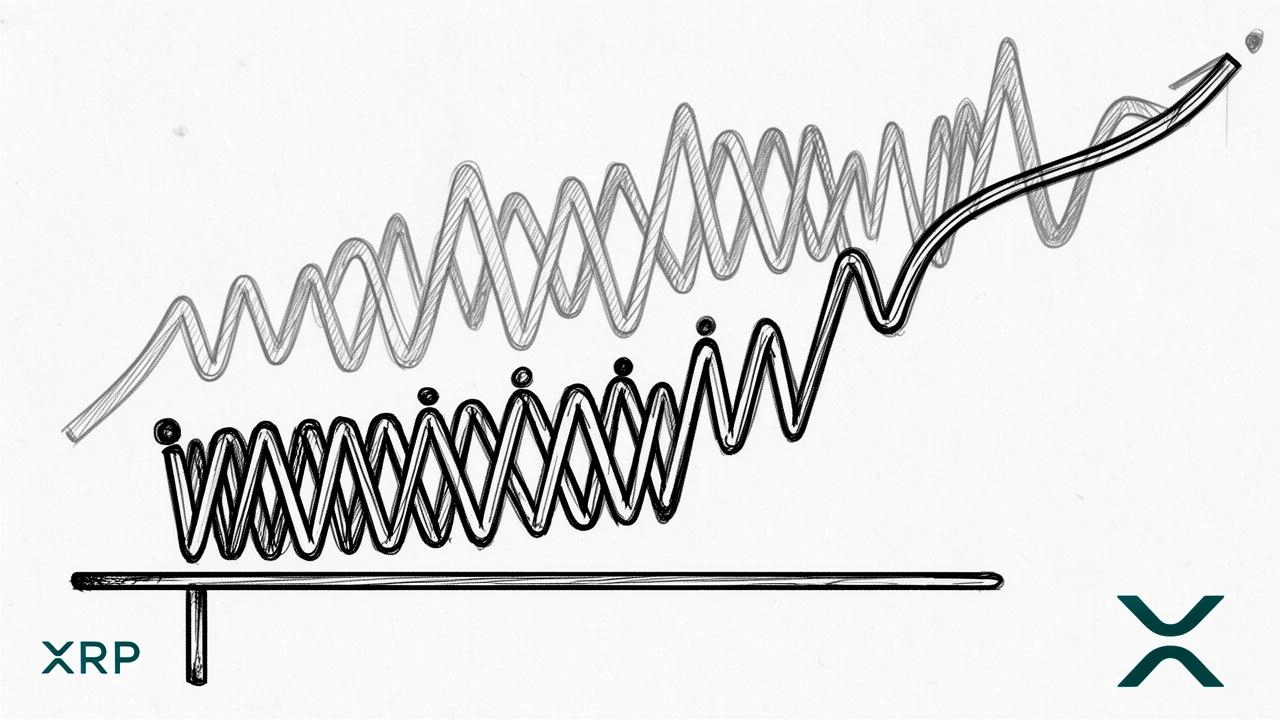
A cryptocurrency analyst known for chart-based predictions is pointing to a recurring technical formation in XRP that he says mirrors conditions seen just before the token’s sharp rally in late summer.
EGRAG CRYPTO, who shares market commentary on social media, posted a one-hour chart showing XRP trading at roughly $1.3202, down 0.32% in the latest session. The analyst’s framework centers on what he calls a fractal, a repeating price structure that some traders use to anticipate future moves.
The earlier sequence ran from July through mid-August, when XRP repeatedly dipped into a narrow band between $0.97 and $1.05 before breaking decisively higher. That breakout eventually carried the token toward a peak just under $1.69, according to the chart. The analyst has circled several instances where the price tested the lower end of that range and bounced, describing the pattern as a structurally significant accumulation phase.
“The fractal is playing out,” EGRAG CRYPTO wrote in the post, suggesting that current market behavior is tracking the earlier setup closely enough to warrant attention.
After the August surge, XRP hit resistance on multiple occasions. White arrows on the chart trace four distinct rejection points, each of which pulled the price lower. Those pullbacks have brought XRP back toward the $1.30 area, which the analyst has marked in green as the immediate support to watch.
The chart also shows a rising white trendline running beneath the price action since the August breakout. XRP is currently testing the area below that line, a position the analyst frames as a potential inflection zone.
| Level Type | Price Levels (USD) |
|---|---|
| Support | $1.30, $1.1522, $1.1000, $1.0500, $0.9700 |
| Resistance | $1.3915, $1.3896, $1.4923, $1.5114, $1.5436, $1.6203, $1.8452, $1.8825, $1.9788 |
Note: Levels are taken directly from the analyst’s published chart and represent horizontal price zones rather than precise execution points.
If XRP loses the $1.30 floor, the next areas of interest sit at $1.1522 and $1.1000, both marked in green. Deeper pullback targets appear at $1.0500 and $0.9700, highlighted in red. On the upside, the chart identifies a dense cluster of resistance levels starting near $1.39 and extending through $1.62, with a horizontal band near $1.8452 and additional targets at $1.8825 and $1.9788 should momentum accelerate.
Fractal analysis rests on the idea that price structures repeat across different timeframes under similar market conditions. It is a method some technical analysts use to project trend direction, though it carries no guarantee of accuracy. The approach has gained a following in crypto circles, where chart-driven narratives often compete with fundamental analysis for influence over trader sentiment.
The current setup leaves XRP in a tight spot. The token sits just above the $1.30 support zone while a cluster of resistance levels hovers overhead, suggesting that any rebound attempt could face persistent selling pressure. Whether the fractal completes in a way that resembles the August breakout, or breaks down instead, could set the tone for the token’s next major move.
For traders watching the same levels, the $1.30 threshold is the line that matters most in the near term. A decisive close below it would open the door to the lower support zones, while a push through the first resistance cluster around $1.39 could signal that the fractal’s bullish phase is still intact.
Once added, BigGo Finance appears first in Google Search Top Stories, so you get the broadest, most up-to-the-minute, and most comprehensive global financial news first.
Source: finance.biggo.com