


Don't want to trade it yourself?
Our desk runs DEX portfolios on profit share.
ArticlesClassGlossaryVideos
Intermediate
Crypto Market Analysis Today: Rate Hike Odds Jump to 86.7%
Update 14 Sep 2026 • Reading Time 10 Minute
Reading Time:10minutes
This crypto market analysis today covers a correction that keeps grinding on while the macro calendar tightens. Bitcoin trades at $77,549.81 as of September 14, 2026, down 2.90% over seven days, while the market has repriced the odds of a Fed rate hike from 48.4% to 86.7% in a single month. Technically, Bitcoin still holds its structure and positive momentum even though macro conditions are working against it. The September FOMC meeting and the CLARITY Act procedural vote will most likely decide where price goes next.
Key Takeaways
- 📉 BTC fell 2.90% on the week to $77,549.81, ETH held flat at $2,511.70, and SOL took the deepest hit at 4.60% down to $101.08 (CoinMarketCap, September 14, 2026).
- 🛢️ August inflation came from the gas pump, not from demand. Headline CPI rose 0.4% month over month while core CPI actually eased to 2.4% year over year.
- ⚠️ Rate hike odds jumped to 86.7% as of September 14, two days before the September FOMC meeting.
- 💸 Spot Bitcoin ETFs logged $462.7 million in outflows across four straight days, while Ethereum ETFs absorbed $222.8 million between September 4 and September 11 (Farside Investors).
- 🏛️ The CLARITY Act was rewritten into a 630-page draft on September 10 with more than 114 Democratic amendments, five days before the procedural vote.
Market Conditions This Week (September 14)
Data: CoinMarketCap as of September 14, 2026.
Bitcoin and Solana fell while Ethereum held flat, supported by ETF flows moving in the opposite direction from Bitcoin. All three still hold the bullish structure they built after the August rally, and all three remain inside their consolidation ranges.
The Fear and Greed Index slipped to 68 from 73 a week ago. Worth remembering that it sat at 34, or Fear, just a month ago. Sentiment has cooled without flipping to fear, and a gradual slide like this looks more like a correction inside an uptrend than the start of a reversal.
Macroeconomic Analysis: Rising Oil Prices Feed Inflation and Make the September FOMC Decisive
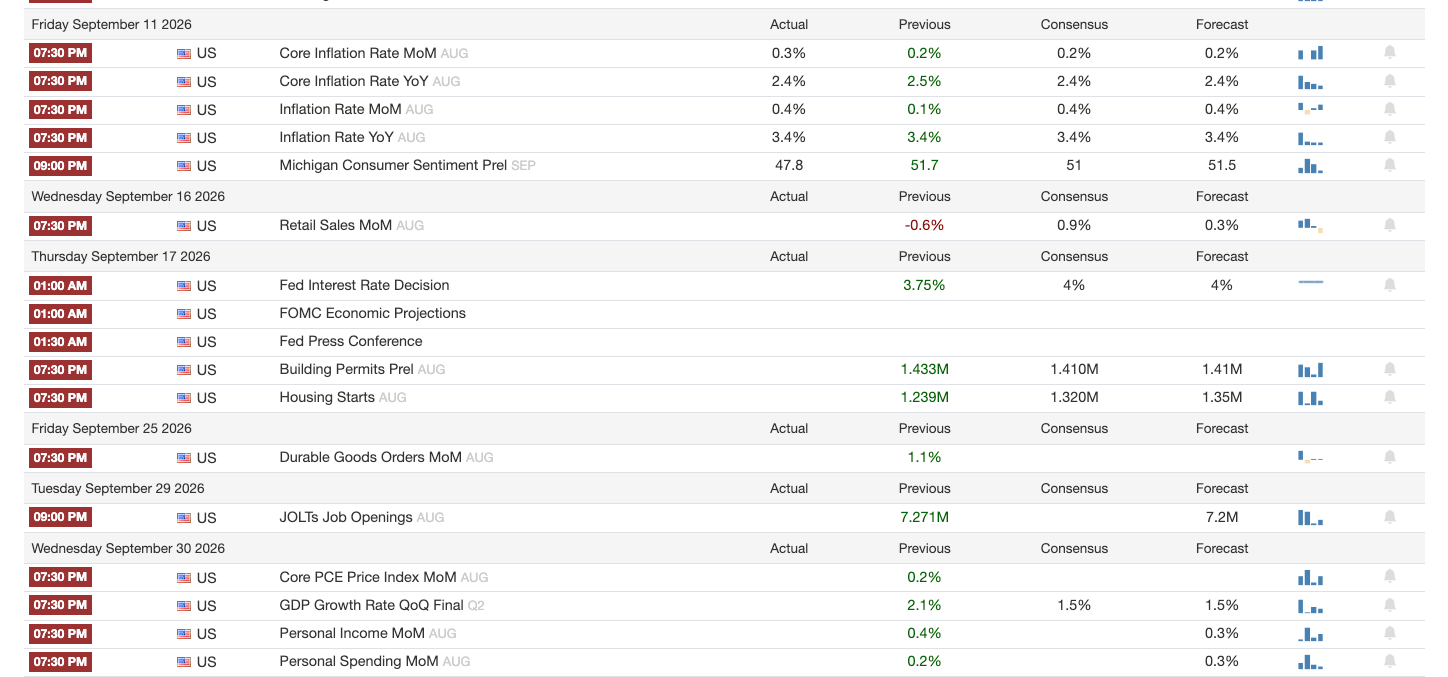
August CPI looked bad at the headline and actually improved in the number the Fed uses to judge demand pressure. Headline CPI rose 0.4% month over month and 3.4% year over year, four times the July increase. Core CPI, which strips out food and energy, rose 0.3% month over month and eased to 2.4% year over year from 2.5% in July.
The component breakdown explains the gap. The energy index rose 2.1% in a month and 16.3% over the year, with gasoline up 3.9% and contributing more than a third of the entire index’s monthly increase. WTI climbed to $103.20 per barrel and Brent to $108.16, both up more than 19% in a month.
Rate hike odds for the September 16 FOMC meeting jumped to 86.7% as of September 14, from 48.4% a month earlier (CME FedWatch, snapshot September 14, 2026). The current policy rate sits at 3.50% to 3.75%.
US Macroeconomic Calendar
The US macro calendar points to extreme volatility over the next three days. The scenario that hurts crypto most is not the hike itself, it is a hawkish dot plot. As of today every analyst already expects rates to rise. A hawkish dot plot, though, stretches the prospect of higher rates out to 2027. Watch the 2027 median dot before reacting to the headline number.
Technical Analysis: BTC, ETH, and SOL
BTC: Holding the $75,000 to $82,000 Range
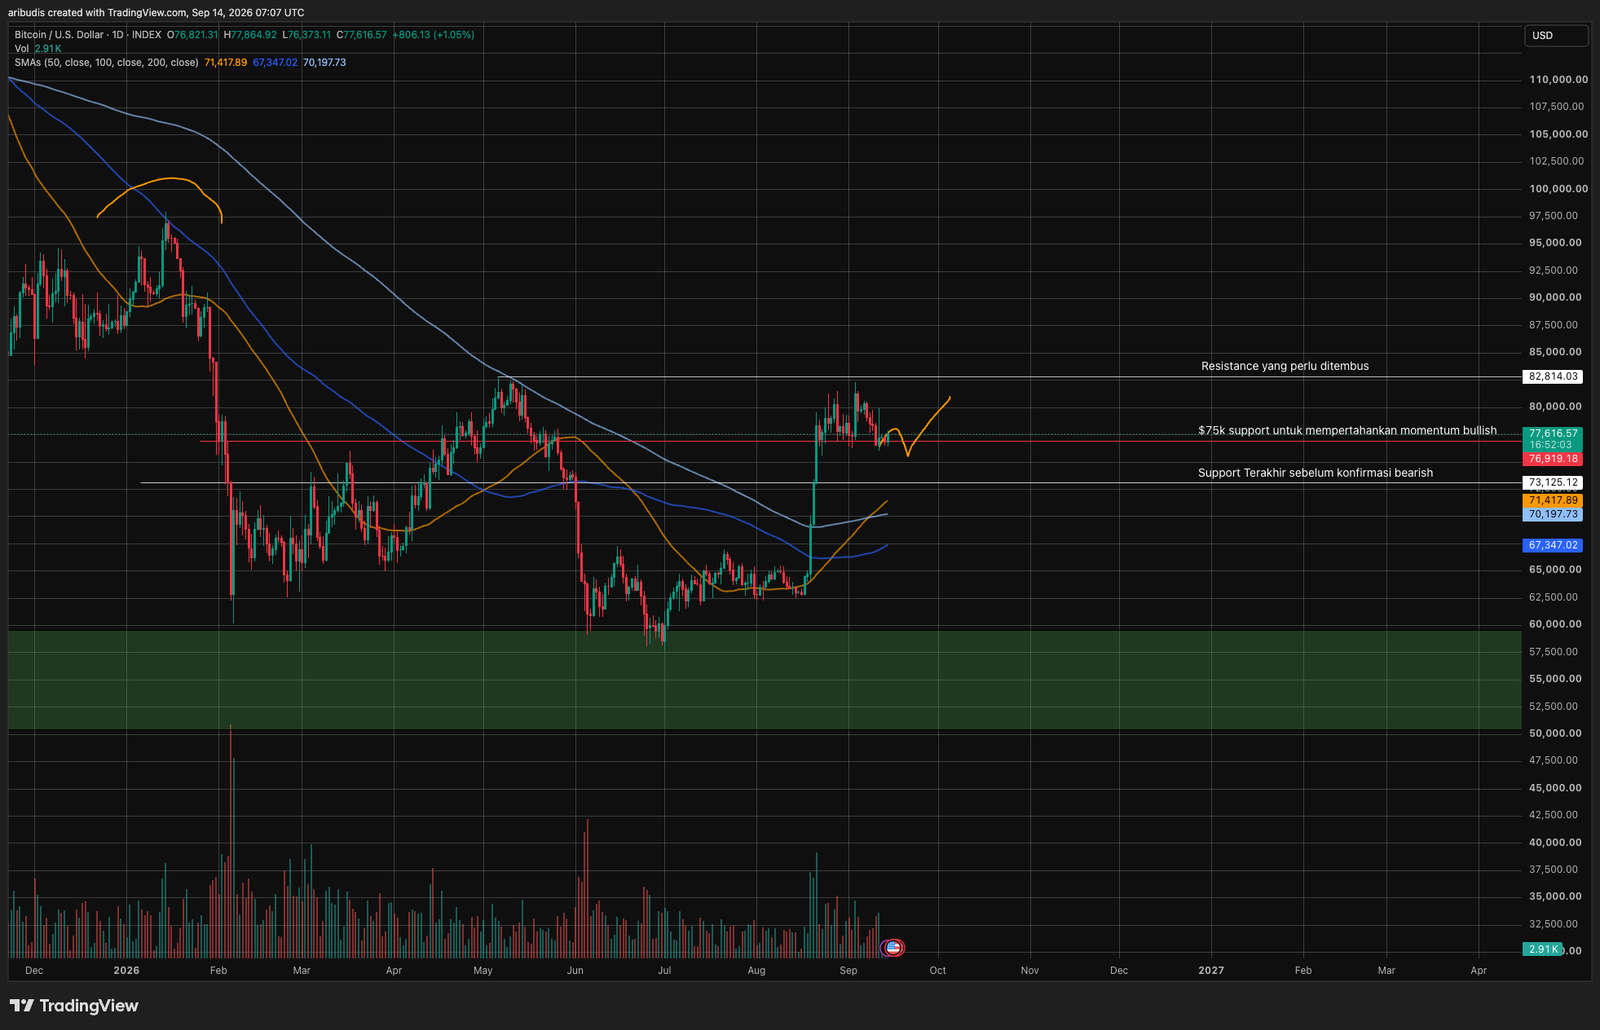
The medium-term trend signal is improving while the short-term structure deteriorates. The 50-day moving average crossed above the 200-day on the daily chart on September 8, the first golden cross since the death cross in November 2025. Bitcoin’s RSI has drifted back to neutral in the 50s while price has moved sideways over the last few sessions.
Stronger confirmation is still missing on the weekly timeframe. Bitcoin’s weekly MACD still shows bullish momentum with its consolidation structure intact. This week’s candle decides whether Bitcoin is distributing, which would be bearish, or consolidating, which would be bullish.
In the short term, the levels flagged in the September 7 analysis have broken. Support at $78,700 to $78,750 has now flipped into the nearest resistance. [INTERNAL LINK: “Analisis Pasar Crypto Hari Ini 7 September 2026”, verify English URL before publishing]
- Nearest resistance: $78,700 to $78,750, former support that has flipped
- Nearest support: $76,320, the swing low that marks the floor of the consolidation scenario
Base case: consolidation between $76,320 and $78,700 until the FOMC result lands. That view breaks if BTC closes a daily candle above $78,750 on rising volume, which would put $80,000 back in reach.
A bearish dot plot alongside a rate hike would likely trigger a correction. In the ideal setup, that becomes a buy the dip opportunity as Bitcoin sweeps the liquidity sitting below the range and reverses quickly.
ETH: Holding Up Because ETF Flows Are Moving Against Bitcoin
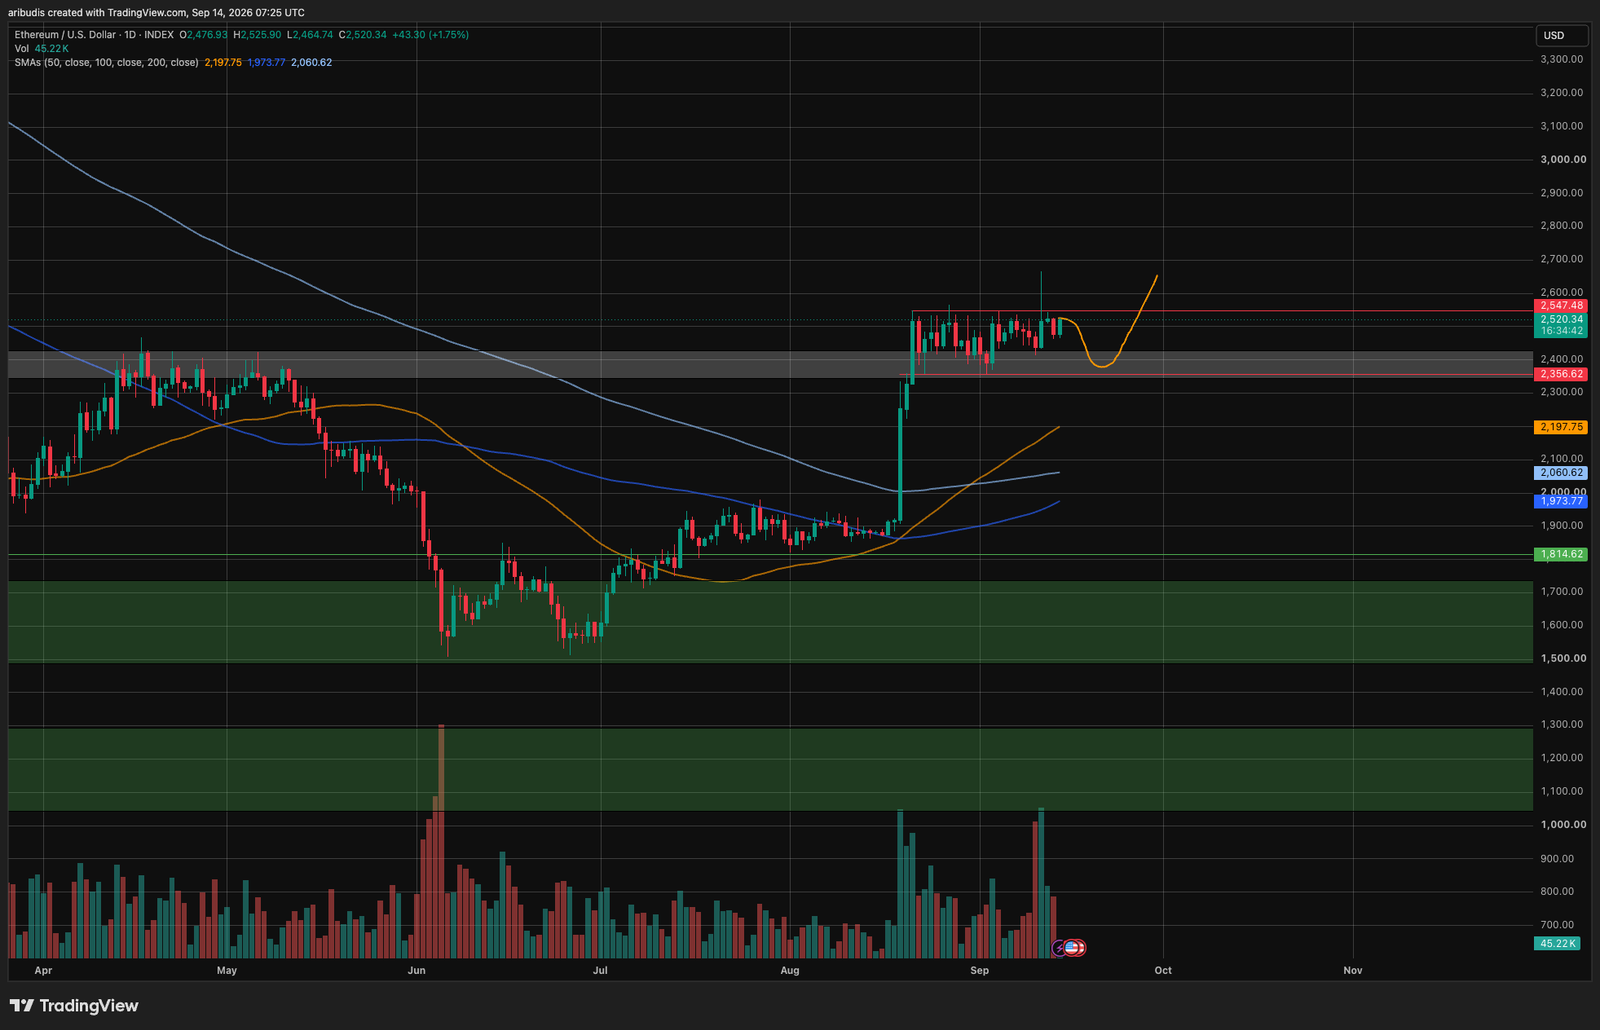
Ethereum is the only one of the three that did not fall this week, and the reason shows up in fund flow data rather than on the chart. ETH held at $2,511.70, unchanged over seven days, while BTC fell 2.90%. Structurally, Ethereum is retesting the resistance zone from April and May 2026. Hold that zone and a continuation breakout becomes likely.
The ideal scenario is a continuation of today’s positive momentum. Given how strong the bearish macro catalysts are, though, a correction is the more probable path. The orange scenario on the chart above would complete an inverse head and shoulders on the daily, which would push ETH into the $2,550 resistance.
Away from the chart, on CPI release day spot Ethereum ETFs recorded $216.4 million of inflows while spot Bitcoin ETFs still posted $13.2 million of outflows (Farside Investors). Between September 4 and September 11, Ethereum ETFs absorbed $222.8 million net, a fourth consecutive week of positive inflows.
Base case: a correction into the narrow $2,380 to $2,420 band ahead of the FOMC, then a rebound to test $2,550. That view breaks if ETH closes a daily candle above $2,550, meaning momentum is simply too strong, or closes below $2,356.
SOL: The Deepest Weakness With No Specific Catalyst
Solana fell 4.60% on the week to $101.08 with no identifiable catalyst behind it. Technically, SOL sits in much the same position as Ethereum. It is retesting the May resistance zone at $95 to $97 after breaking out, and that zone is the one that matters in the current correction.
Base case: an FOMC-driven correction into the narrow $95 to $97 band. That correction scenario breaks if the FOMC turns out bullish and SOL holds above $100. The next resistance sits in the narrow $107 to $110 band.
On-Chain Data and Institutional Flows
Bitcoin Spot ETF Flows
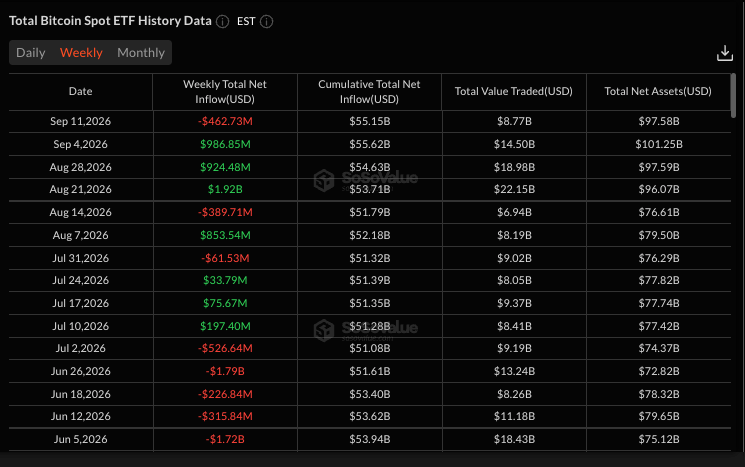
Bitcoin has swung back to negative ETF flows after three consecutive positive weeks. Four straight days of outflows from spot Bitcoin ETFs mark a sharp reversal from the week before, and the timing tracks the macro data rather than any crypto news.
Daily spot Bitcoin ETF outflows: September 8 at $46.6 million, September 9 at $120.2 million, September 10 at $282.7 million, and September 11 at $13.2 million. That totals $462.7 million across four days.
That said, one negative week does not erase the significant positive flows recorded since mid-August 2026. The prior week alone brought in $986.85 million. This week’s outflows only clip part of the accumulation built up over the month.
The split between Bitcoin and Ethereum ETF direction is the most interesting thing in this week’s data. Unlike Bitcoin, Ethereum ETF flows extended their positive run, at $197.11 million last week and $218.41 million in early September. Those flows are notable because Ethereum is in the middle of the Glamsterdam upgrade, which is set to improve network performance.
Read more on Pintu Academy about the Glamsterdam upgrade and what it could mean for the Ethereum network and the ETH price. [INTERNAL LINK: “Apa itu Ethereum Glamsterdam Upgrade”, verify English URL before publishing]
On-Chain Data: Tokenized Stock Market Cap Growing Fast Through the Bear Market
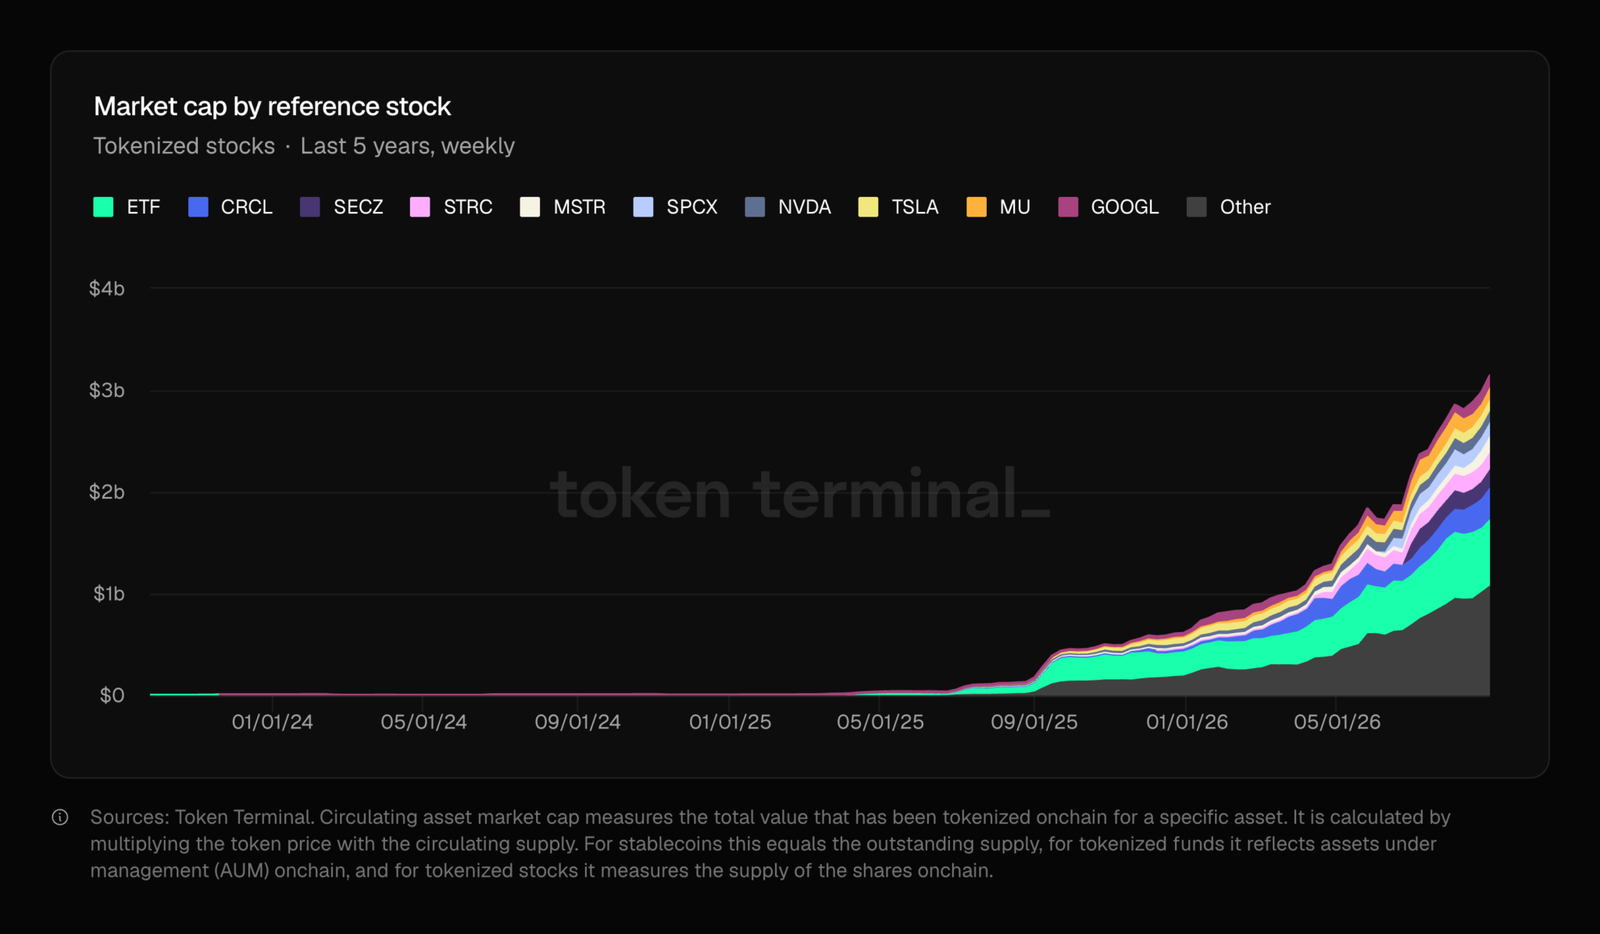
Tokenized stock market capitalization reached $3.144 billion at the end of August 2026, up from roughly $610 million at the start of the year and $2.3 billion in mid-July (Token Terminal). Tokenized ETFs account for $644 million, or about 21% of the total. Most tokenized stocks now live on BNB Chain with $1 billion or 33%, followed by Ethereum at $770 million and Solana at $716 million.
Crypto News That Mattered This Week
- The CLARITY Act was rewritten from the ground up five days before the vote: Senator Cynthia Lummis circulated a new 630-page version on September 10 that folds in more than 114 Democratic amendments, narrows the decentralized finance rules to spot and cash digital commodity transactions only, and adds circuit breakers for stablecoins. A rewrite this large five days out signals that Republicans did not believe the previous version would pass.
- The ethics framework remains the main obstacle: The September 15 procedural vote needs 60 votes while Republicans control only 53 seats. Democrats continue to object to the absence of guardrails around President Trump’s crypto holdings. Senator Thom Tillis has said the White House needs to help draft the ethics framework. Failure is still the market’s base expectation, so the price impact should be smaller than the headlines suggest.
- The banking industry opposes parts of the bill: 77 state banking associations joined the American Bankers Association in opposing several provisions, particularly those covering stablecoin yield, which they argue could pull deposits out of banks.
Best and Worst Performing Cryptocurrencies This Week
- Civic +78%
- Metal (MTL) +56%
- Koma Inu (KOMA) +52%
- Renzo +46%
- Power Ledger +34%
- Audiera (BEAT) -32%
- Velvet (VELVET) -31%
- NFPrompt -28%
- Fabric Protocol (RABO) -27%
- Ravencoin -27%
Data: Pintu Market page as of September 14, 2026.
The spread this week points to rotation into small caps. The gap between the best and worst performer runs to roughly 110 percentage points, while Bitcoin moved just 2.90% over the same stretch. All ten names also sit well outside the ten largest by market cap. If this week’s Bitcoin correction were really driven by broad risk aversion, small caps would be falling hardest and the best performer list would be hard to fill. The opposite happened, which fits the reading of a correction inside a trend that is still intact.
The gains in Civic, Metal, and Koma Inu this week do not trace back to any single event. Moves of several dozen percent in thinly traded assets usually come from short-term positioning rather than any change in project fundamentals, and moves like that tend to reverse as fast as they appear. The size of the percentage is also misleading if you read it without checking market cap, because relatively little capital is enough to move an asset with a thin order book. Treat these numbers as a gauge of momentary risk appetite rather than a buy signal.
Conclusion: Wait for the Dot Plot, Not the Rate Decision
Technical structure and macro conditions are pointing in different directions, and this week macro sets the price first. Bitcoin, Ethereum, and Solana all still hold the consolidation structure built after the August rally, and none of the three has broken its invalidation level. But rate hike odds jumping from 48.4% to 86.7% in a month is a 38 percentage point repricing that the market has not finished absorbing.
Our base case is consolidation between $76,320 and $78,700 until the FOMC wraps up. That view breaks if BTC closes a daily candle above $78,750 on supporting volume.
What matters most is not the rate decision itself, it is the 2027 median projection in the dot plot. August inflation came from oil prices. If the Fed treats that as a demand problem, the high-rate horizon gets extended to fix something rates cannot reach.
Long-term investors have no reason yet to change position over this week’s correction. ETF inflows since mid-August remain positive and sentiment still sits in Greed territory. Short-term traders face a different calculation. Sitting on your hands until the FOMC result lands makes more sense than positioning ahead of the part of the event the market has not priced.
Frequently Asked Questions
What happens to crypto prices if the Fed raises rates in September?
Most of the impact is already in the price, because the market puts the odds of a hike at 86.7%. The bigger risk sits in the dot plot released alongside the decision, which shows how long each committee member expects rates to stay elevated. A hawkish 2027 median would force the market to reprice the entire rate path rather than a single meeting.
Why is Bitcoin falling when inflation data came in mixed?
Headline CPI rose 0.4% month over month, driven mostly by gasoline, while core CPI eased to 2.4% year over year. The market reacted to the headline number by pricing in a September hike, and higher rates raise the opportunity cost of holding an asset that pays no yield. The correction is a response to the rate repricing rather than to the underlying demand picture.
Do $462.7 million in ETF outflows mean institutions are leaving Bitcoin?
No. Spot Bitcoin ETFs posted positive inflows for three consecutive weeks before this, including $986.85 million in the prior week, so this week’s outflows only clip part of the accumulation built since mid-August. Ethereum ETFs took in $222.8 million over the same stretch, which points to capital rotating inside crypto rather than leaving it.
What is the CLARITY Act and what happens if the September 15 vote fails?
The CLARITY Act is US legislation that would set out how digital assets are regulated and which agency oversees them. Failure is already the market’s base expectation, since Republicans hold 53 seats against the 60 votes needed, so the price impact should be smaller than the headlines suggest. The real surprise would be the bill clearing 60 votes, and that outcome is not priced in.
How to Invest in Crypto on Pintu?
- Open and log in to your Pintu app account.
- Go to the Market menu.
- Search for the asset with the ticker BTC.
- Enter the Rupiah amount you want to invest, minimum Rp11,000.
- Confirm and complete the transaction.
Download the Pintu crypto app on the Play Store and App Store! Your security is assured because Pintu is licensed and supervised by the Financial Services Authority (OJK) & CFX.
Disclaimer
This article is for educational purposes only and does not constitute investment advice. Crypto asset prices are volatile and subject to change. Always do your own research (DYOR) before investing.
References
- Bureau of Labor Statistics, “Consumer Price Index Summary, August 2026”, bls.gov, September 11, 2026. https://www.bls.gov/news.release/cpi.nr0.htm
- CoinDesk, “Bitcoin’s Golden Cross Is Here. What Next?”, September 8, 2026. https://www.coindesk.com/markets/2026/09/08/bitcoin-s-golden-cross-is-here
- CoinMarketCap, price data for BTC, ETH, SOL, and the Crypto Fear and Greed Index, accessed September 14, 2026. https://coinmarketcap.com
- Farside Investors, “Bitcoin ETF Flow” and “Ethereum ETF Flow”, accessed September 14, 2026. https://farside.co.uk/btc/
- SoSoValue, spot Bitcoin ETF flow data, accessed September 14, 2026. https://sosovalue.com
- Token Terminal, tokenized stock market capitalization data, accessed September 14, 2026. https://tokenterminal.com
- Pintu, Market page, seven-day performance data, accessed September 14, 2026. https://pintu.co.id/en/market
- Trading Economics, “Crude Oil”, accessed September 14, 2026. https://tradingeconomics.com/commodity/crude-oil
- CME Group, “CME FedWatch Tool”, snapshot September 14, 2026. https://www.cmegroup.com/markets/interest-rates/cme-fedwatch-tool.html
- Blockonomi, “Senate Republicans Unveil Overhauled Clarity Act Before Critical September Vote”, September 11, 2026. https://blockonomi.com/senate-republicans-unveil-overhauled-clarity-act-before-critical-september-vote
Related Article
What Is Danaher (DHR) Stock and DHRx Tokenized Stock?
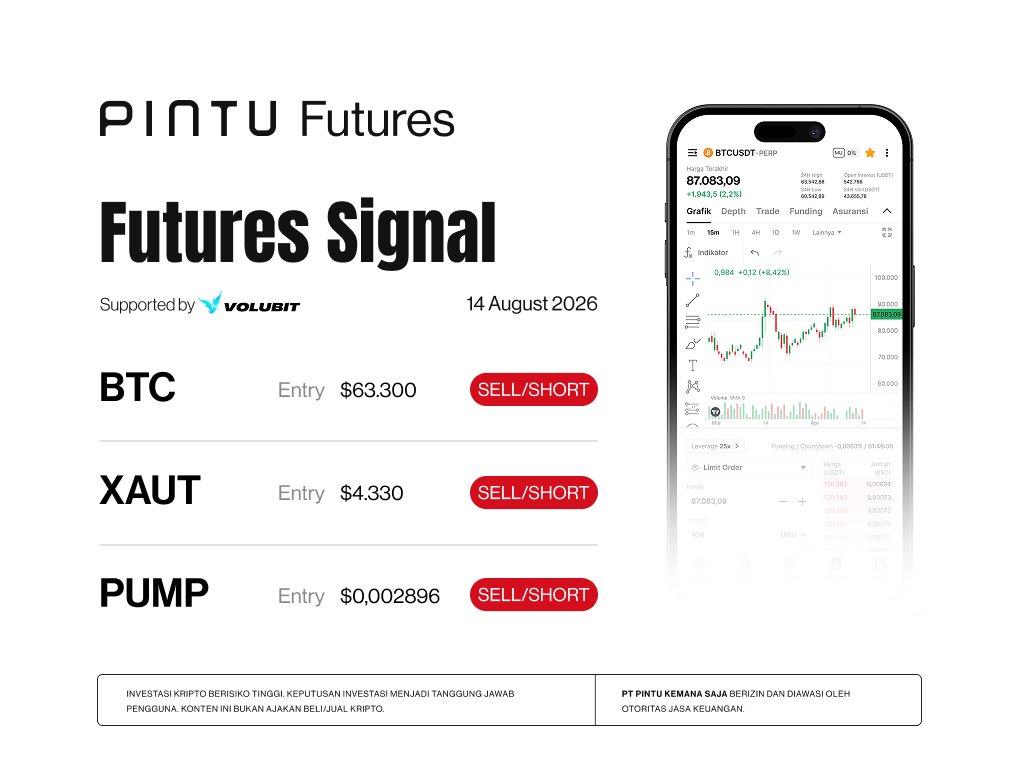
Crypto Futures Signal Pintu X Volubit, Friday, August 14, 2026
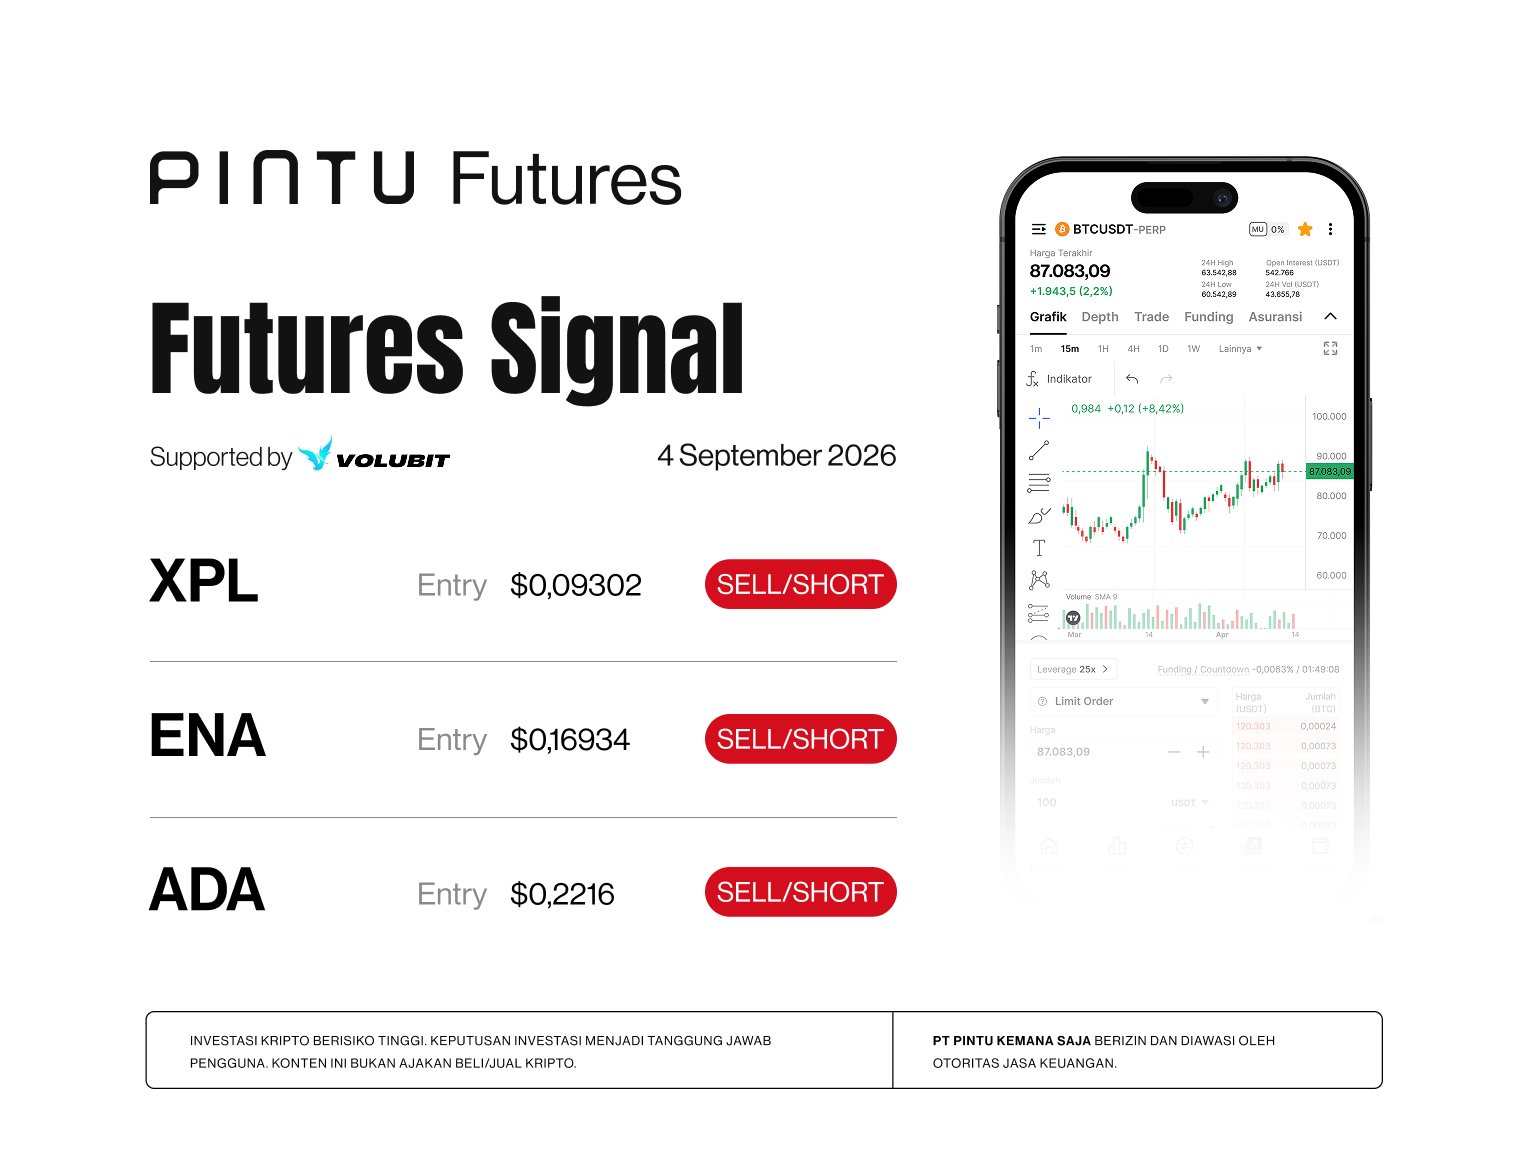
Crypto Futures Signal Pintu X Volubit, Friday, September 4, 2026
RVN
->
NFP
->
POWR
->
REZ
->
CVC
->
Not yet available on Pintu Pro
Source: pintu.co.id
1 Comment
Pingback: S&P Global Leads Kaiko’s $110 Million Series B Extension With BNP Paribas, Coinbase Ventures: 15 outlets compared – xpertsstudio