


Don't want to trade it yourself?
Our desk runs DEX portfolios on profit share.
On September 8, 2026, the total crypto market cap dropped 3.47% after a Bitcoin-related security incident rattled sentiment. The Chainlink price today holds at $12.67, caught between a firmly bullish daily structure and short-term momentum that is visibly losing steam.
Key takeaways
- Chainlink trades at $12.67, just below the daily pivot of $12.68, with the full daily EMA stack aligned bullishly.
- Daily RSI14 at 66.9 and a thinning MACD histogram suggest upward acceleration is slowing.
- The 1-hour chart flips bearish: RSI at 43.72 with MACD fully in negative territory.
- Total crypto market cap fell 3.47% in 24 hours, yet the Fear & Greed Index remains at 69 (Greed).
- Bollinger Bands place price near the upper band at $12.89, with daily ATR14 of $0.66 highlighting meaningful swing potential.
Daily Chart: Bullish Structure Remains Intact
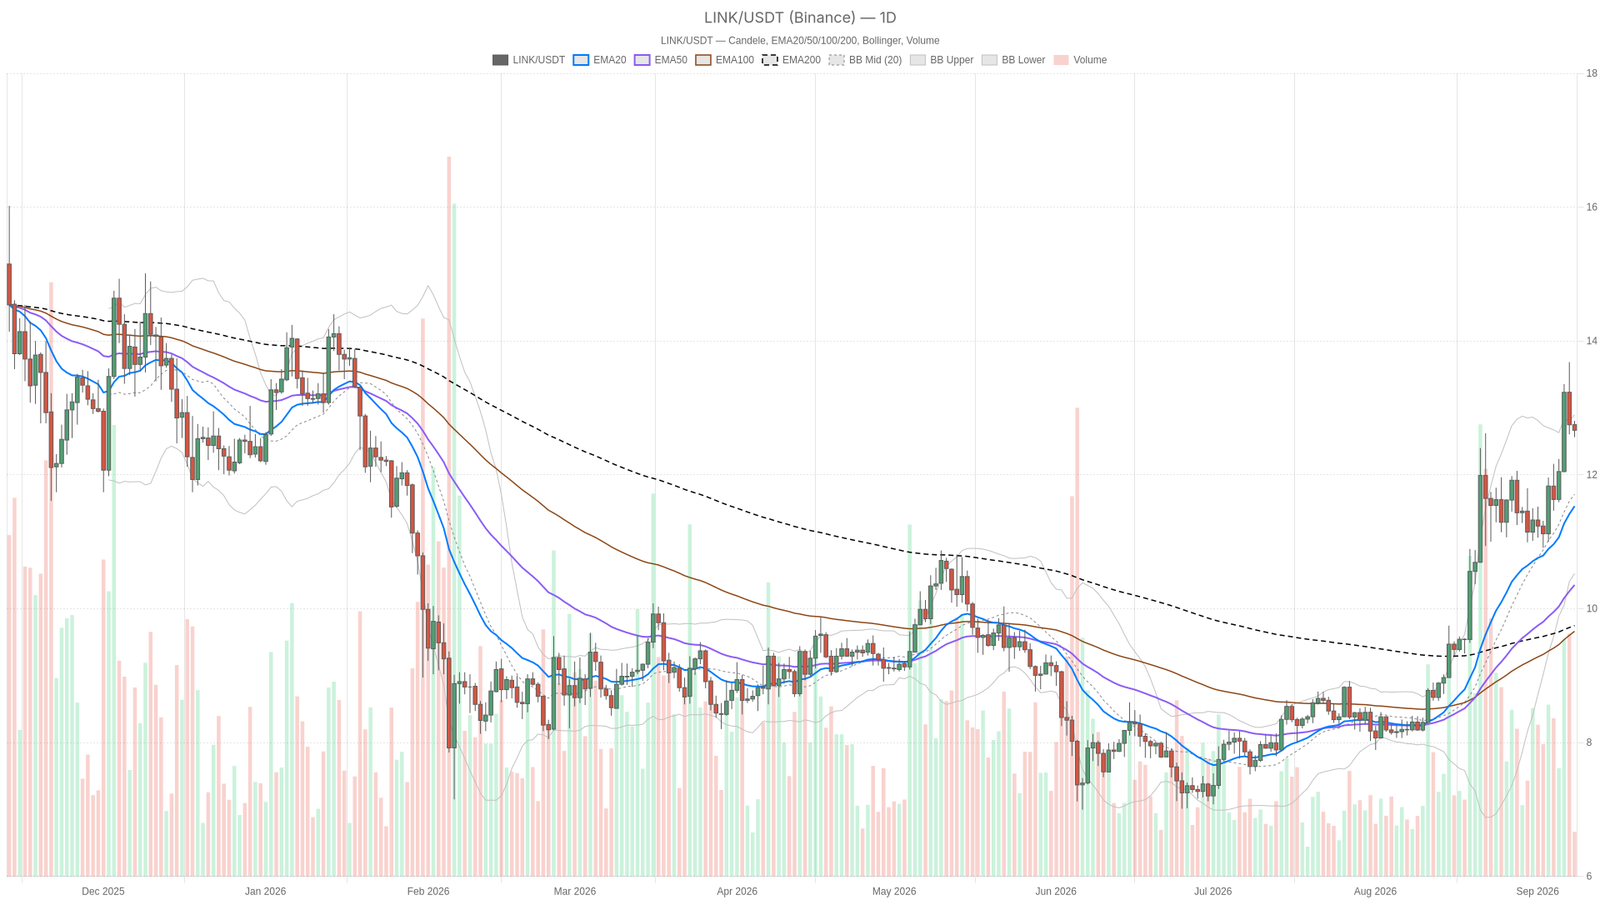
Zooming out to the daily timeframe, the Chainlink price today still reflects a textbook bullish structure. $LINK trades at $12.67, comfortably above its EMA20 at $11.53, EMA50 at $10.35, and EMA200 at $9.75. This is a classic bullish stack — short-term above medium-term, above long-term — confirming the uptrend has been building steadily rather than erupting in a single spike.
Meanwhile, the daily RSI14 reads 66.9, elevated but not yet in classic overbought territory, which usually begins around 70 to 80. The market has been persistently bought but still has room before looking stretched. The daily MACD reinforces this reading: the MACD line at 0.76 remains above the signal line at 0.71, with a histogram of 0.05 — positive but noticeably thinning. That shrinking histogram does not invalidate the bullish case, but it does indicate the daily push higher has lost some acceleration.
The Bollinger Bands add another dimension. Price at $12.67 sits near the upper band at $12.89, with the mid-band at $11.71 and the lower band at $10.53. Trading near the upper band during an uptrend is normal for a trending asset — it is not automatically a sell signal. However, it does suggest limited room to extend before either band expansion triggers continuation or a pullback toward the mid-band materializes. The daily ATR14 at $0.66 confirms this is not a low-volatility environment.
Short-Term Timeframes: Hesitation Takes Hold
On the 1-hour chart, $LINK’s regime flips to neutral. Price at $12.67 sits just below its EMA20 at $12.77 and EMA50 at $12.69, though it remains above the EMA200 at $12.08. That EMA20/EMA50 compression near price signals a market that has stalled after its run, rather than one still pushing aggressively higher.
The 1-hour RSI14 has dropped to 43.72 — below the midpoint — confirming short-term momentum has genuinely rolled over, at least temporarily. Moreover, the 1-hour MACD reinforces this softness: the MACD line stands at -0.06, the signal line at -0.04, and the histogram at -0.02. All three readings are negative. On an hourly basis, this market leans bearish even while the daily trend above it remains intact.
The 1-hour Bollinger Bands, with a mid-band at $12.78, upper at $13.07, and lower at $12.50, show price hugging the lower half of the range — another sign buyers have stepped back for now. The hourly ATR14 of $0.11 confirms conditions have calmed considerably compared to the daily reading; this is consolidation, not panic.
On the 15-minute chart, the picture flattens further. Price at $12.67 sits almost exactly between EMA20 at $12.66 and EMA50 at $12.72, with RSI at 48.99 — dead neutral. The MACD, with the line at -0.02, signal at -0.02, and histogram at +0.01, shows virtually no directional bias. Meanwhile, the 15-minute pivot cluster is extremely tight: PP at $12.66, R1 at $12.68, and S1 at $12.64. For execution, this timeframe signals it is better to wait for a trigger than to force a trade.
The Bullish Case
That said, the path higher for $LINK remainslose the EMA20 zone near $11.53 on a closing basis. A reclaim of hourly momentum — RSI back above 50 and the MACD histogram flipping positive — combined with a push through the daily R1 at $12.79, would signal buyers have absorbed this short-term pause. In that scenario, the daily uptrend resumes after a shallow hourly-level rest, a very normal pattern within a healthy trend
The Bearish Case
The bearish risk here is not about the daily trend breaking outright. Instead, it is about whether this hourly weakness deepens into something more consequential. If price loses the daily S1 at $12.55 and begins probing toward the Bollinger mid-band at $11.71, that would be the first real sign the daily rally is entering a proper corrective phase rather than just pausing briefly. A daily close below the EMA20 at $11.53 would more clearly invalidate the bullish structure altogether.
Moreover, with BTC dominance near 58.92%, according to CoinGecko-ve to shifts in overall risk appetite. The Bitcoin-related headline currently circulating is exactly the type of event that can trigger a flight away from higher-beta assets, adding weight to the cautious view
Positioning and Risk
Right now, $LINK’s setup is a study in conflicting timeframes: the daily chart says trend-follow, the hourly chart says be patient, and the 15-minute chart says there is no edge yet. That is not a reason to freeze, but it is a reason to size positions with the daily ATR of $0.66 in mind — this asset can move meaningfully in either direction within a single session.
The elevated Fear & Greed reading at 69 alongside a falling total market cap represents a genuine mismatch worth monitoring over the next few sessions. Sentiment indicators and price action rarely stay disconnected for long. Whichever way this resolves, the daily pivot near $12.68 and its surrounding S1/R1 band will likely be the first tell of which side is winning. In a market this reactive to headlines, volatility cuts both ways, and confirmation matters more than prediction.
What is the current price of $LINK?
As of September 8, 2026, $LINK trades at $12.67, sitting just below the daily pivot at $12.68 after an extended run above its longer-term moving averages.
Is the Chainlink daily uptrend still intact?
Yes, the daily trend remains firmly bullish. $LINK trades above all major EMAs — EMA20 at $11.53, EMA50 at $10.35, and EMA200 at $9.75 — forming a textbook bullish stack. However, daily momentum is showing signs of deceleration with a thinning MACD histogram.
What are the key support levels to watch for $LINK?
The immediate support sits at the daily S1 of $12.55. Below that, the Bollinger mid-band at $11.71 and the EMA20 at $11.53 represent more significant levels. A daily close below $11.53 would invalidate the current bullish structure.
Why is the crypto market declining despite elevated greed?
The total crypto market cap dropped 3.47% over 24 hours while the Fear & Greed Index remains at 69, firmly in Greed territory. This divergence was partly triggered by a Bloomberg report on a Bitcoin hack that resurfaced concerns about crypto vulnerabilities. Such sentiment-price disconnects often precede either a shakeout or a genuine pause in the rally.
Disclaimer: This article is for informational purposes only and does not constitute financial advice, an investment recommendation, or a solicitation to buy or sell any financial instrument or cryptocurrency. The analysis provided is not indicative of future results. Investing in crypto assets and financial markets carries a high risk of capital loss. Always do your own research (DYOR) and consult a qualified financial advisor before making any decision.
Article produced with the assistance of artificial intelligence and reviewed by the editorial team.
Source: cryptonews.net
2 Comments
Pingback: Bitcoin remains highly sensitive to macro signals amid changing derivatives narrative – xpertsstudio
Pingback: Could These 2 Events Finally Trigger a Move Toward $2? – xpertsstudio