

Don't want to trade it yourself?
Our desk runs DEX portfolios on profit share.
Add to Google Preferred Sources
U.S. <a href="https://xpertsstudio.com/320m-bitcoin-exploit-explained-2026/” title=”$320M Bitcoin Exploit Explained [2026]”>Bitcoin and Ethereum spot ETFs pulled in $1.1 billion in net inflows last week. Bitcoin ETFs attracted $968.9 million while Ethereum ETFs drew $130.3 million, with 78.5% of the total — $863.2 million — concentrated in a single day. Ethereum ETF weekly net inflows plunged 82.3% week-over-week, dropping to an 11.9% share of total ETF inflows. Despite the slowdown in ETF flows, both assets posted price gains. Ethereum faces resistance at the $2,560 level while exchange outflows continue to tighten supply, with over 116,000 ETH withdrawn from exchanges in 48 hours. Network active addresses remain below 500,000, lagging the price rebound.
Key Elements
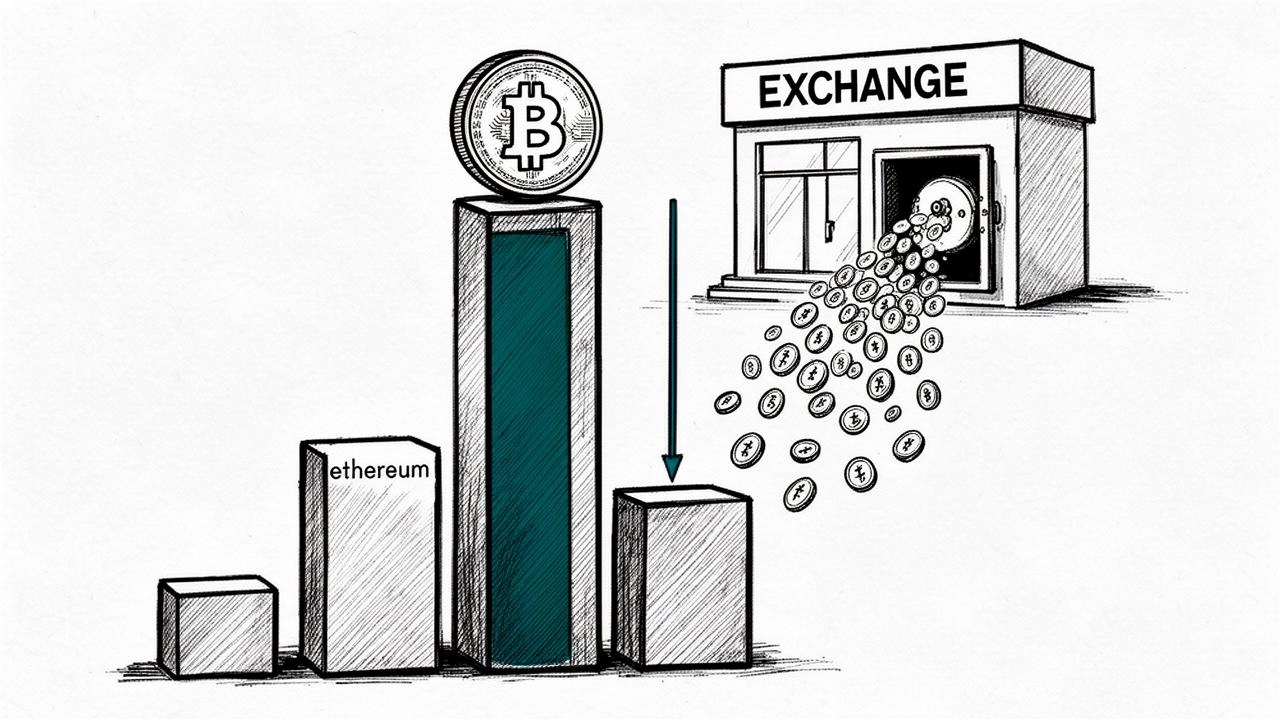
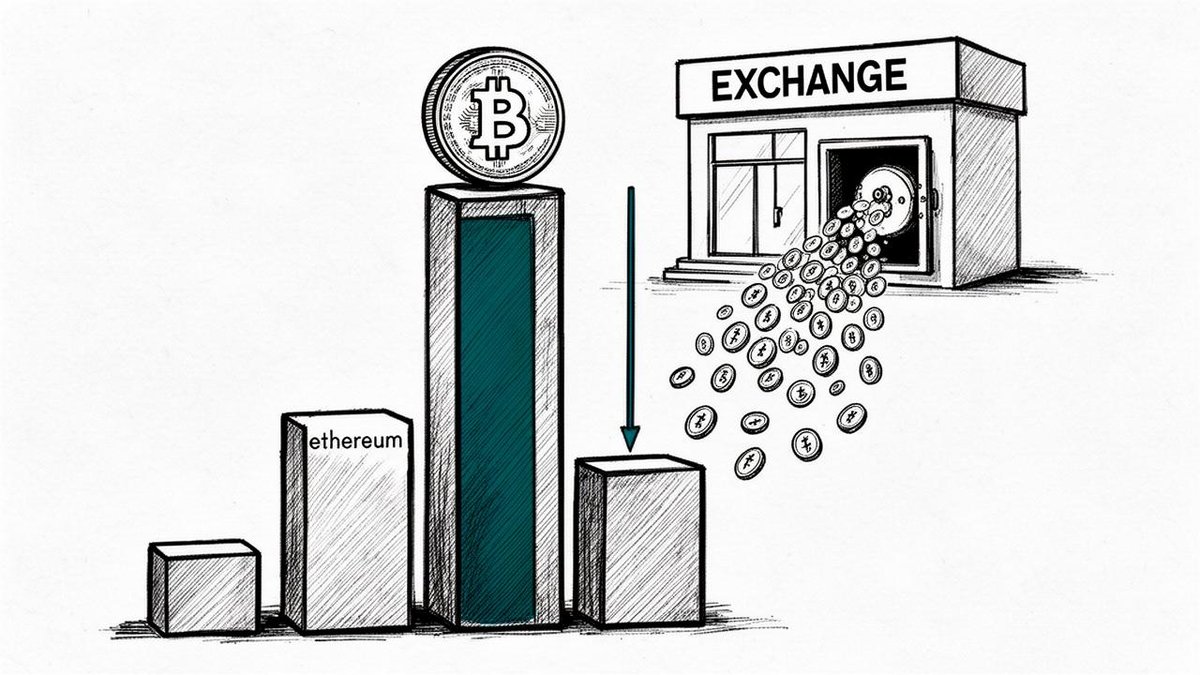
U.S. Bitcoin (BTC) and Ethereum (ETH) spot exchange-traded funds (ETFs) recorded $1.1 billion in net inflows last week. However, roughly 80% of total inflows were concentrated in a single day, underscoring a pronounced skew in capital flows.
According to CoinMarketCap data as of September 8 (local time), Bitcoin spot ETFs attracted $968.9 million and Ethereum spot ETFs drew $130.3 million between August 31 and September 4. The combined $1.1 billion in net inflows represents a 32.8% decline from the prior week.
Notably, $863.2 million flowed in on September 3 alone, accounting for 78.5% of the week’s total net inflows. That marked the largest single-day combined net inflow for Bitcoin and Ethereum spot ETFs since January 14.
Capital tilted heavily toward Bitcoin. Ethereum spot ETF weekly net inflows tumbled 82.3% from the prior week, and its share of total ETF net inflows fell from 45.0% to 11.9%. SoSoValue data corroborates this trend. Ethereum ETFs saw their largest single-day net inflow in September reach just $59,300, breaking a previous streak of 12 consecutive days with cumulative inflows exceeding $1 billion.
Despite the slowdown in ETF inflows, prices rose. Based on CoinMarketCap opening prices, Bitcoin gained 2.77% and Ethereum climbed 2.60% during the period — a stark contrast to the prior week when both assets declined.
In the Bitcoin derivatives market, leverage expansion remained limited. Over the week through September 6, Bitcoin open interest (OI) edged down 0.6% to $53.15 billion, while funding rates slipped from 0.54 basis points to 0.50 basis points.
The spot market, however, showed improving buy-side demand. Net taker flow over the three trading sessions through September 4 reached $294 million, indicating a clear buy-side advantage. Compared with the prior week’s near-balanced buy/sell activity, spot buying momentum has strengthened.
Ethereum Technical Resistance and Exchange Outflows
Ethereum has reclaimed the $2,500 level but faces stiff resistance near $2,560. Unlike Bitcoin, which has broken above $82,000 and continues its upward trajectory, Ethereum has gained only about 5% in recent trading, hovering around $2,498. Its market capitalization stands at $304.85 billion, with daily trading volume of $10.68 billion.
Market observer Ali Charts reported that more than 116,000 ETH — worth approximately $300 million — has been withdrawn from exchanges over the past 48 hours. He noted that such rapid contraction in exchange supply is creating conditions for a major price move.
Technical analyst Bitcoin Meraklisi assessed that Ethereum, after reclaiming the $2,381 resistance zone, is now trading within the $2,381–$2,515 range. In his view, $2,515 is the key threshold for an upside breakout, with initial targets of $2,750, then $3,400, and up to $4,750 if bullish momentum persists.
Ethereum’s weekly relative strength index (RSI) has moved beyond its typical range, while the 20-day moving average at $2,418.98 continues to trend upward, providing technical support below the current price.
Network Activity and Real-World Asset Ecosystem
Blockchain network activity indicators are failing to keep pace with the price rebound. Daily active addresses have been declining since early August and have remained below 500,000 throughout this month — a decline of more than 5% year-over-year.
According to Coinglass data, Ethereum trading volume surged 81.78% to $29.08 billion. Open interest rose just 0.34% to $32.86 billion. The combination of surging volume and stable open interest suggests active market participation without significant expansion of leveraged positions.
Ethereum’s real-world asset (RWA) ecosystem continues to maintain expansion momentum. According to Token Terminal, the total market capitalization of stablecoins on the Ethereum network has reached $163.5 billion. Tokenized investment funds stand at $17.5 billion, commodity tokens at approximately $5 billion, and equity-linked tokens at $770.1 million.
Large holder activity has also intensified recently. More than 1 million ETH was transferred across over 650 individual transactions. One address deposited 70,000 ETH (approximately $174 million) to an exchange while separately holding 97,114 ETH.
As capital concentration between Bitcoin and Ethereum in the ETF market becomes increasingly pronounced, Ethereum’s ability to break through technical resistance and the ongoing decline in exchange supply are emerging as the key variables that will determine its future price direction.
Once added, BigGo Finance appears first in Google Search Top Stories, so you get the broadest, most up-to-the-minute, and most comprehensive global financial news first.
Source: finance.biggo.com