


Don't want to trade it yourself?
Our desk runs DEX portfolios on profit share.
Ripple Price Today: XRP Stalls at $1.40 as Bulls and Bears Split
As of September 7, 2026, the Ripple price today sits near the $1.40 mark, a level that has become a magnet for $XRP over recent sessions. The daily chart tells a different story than shorter timeframes — a tension traders must understand before taking a position.
Key takeaways
- $XRP trades at $1.40, holding above the 20, 50, and 200 daily EMAs.
- Daily MACD shows a momentum stall with the histogram at -0.01.
- Total crypto market cap fell 3.12% while $BTC dominance rose to 59.12%.
- The Fear & Greed Index remains at 71 (Greed) despite the broader pullback.
- The 1.38–1.42 zone is the critical range for the next directional move.
Zooming out to the wider market, the backdrop is not exactly calm. Total crypto market capitalization slipped 3.12% over the last 24 hours to roughly $2.69 trillion while Bitcoin dominance climbed to 59.12%. That combination usually means altcoins like $XRP are fighting an uphill battle for attention, even when their own charts look constructive
Interestingly, the Fear & Greed Index still reads 71, solidly in Greed territory, which creates its own contradiction: sentiment has not caught up with the pullback in total market value yet.
Daily Structure Still Favors Bulls, But Momentum Is Cooling
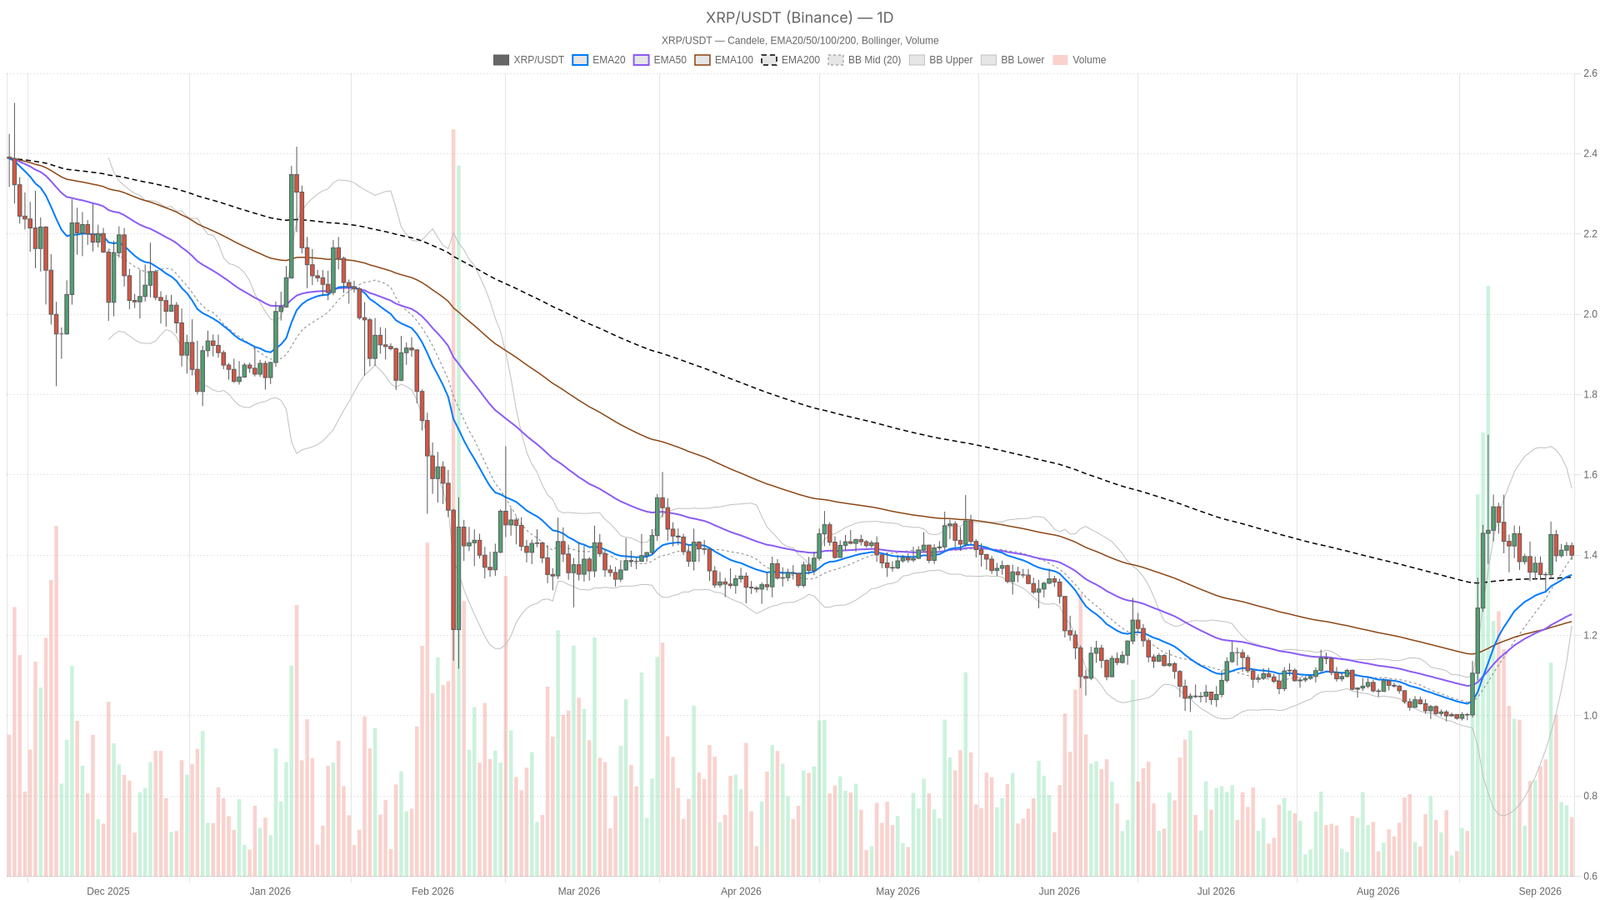
On the daily timeframe, $XRP is trading at 1.40, comfortably above its 20-period EMA (1.35), its 200-period EMA (1.34), and its 50-period EMA (1.25). That stacking — price above all three EMAs, with the 50 sitting below the 200 — tells a story of a market that dipped hard at some point and has since clawed its way back, with short-term momentum now leading the recovery. This structure keeps buyers in control on a macro basis, at least for now.
The RSI on the daily sits at 58.99 — not hot, not cold, just comfortably on the bullish side of neutral. There is room to push higher before anyone starts talking about overbought conditions, but it is also not screaming conviction.
The more telling signal comes from the MACD, where the line (0.07) and signal (0.07) are essentially glued together with a slightly negative histogram of -0.01. That is a momentum stall right at the crossover point — the kind of setup that can resolve either way. In plain terms: the trend structure says bullish, but the momentum engine is idling.
Bollinger Bands on the daily show price parked almost exactly at the midline (1.40), with the upper band at 1.57 and the lower band at 1.22. That is a wide range with price sitting dead center — a classic signal of indecision. Daily ATR reads 0.08, meaning volatility is far from dead even if direction is unclear.
Pivot levels frame the near-term battle tightly: pivot point at 1.41, resistance at 1.42, support at 1.38. Price sits just below its own pivot, a subtle tell that buyers have not fully reclaimed control of the session.
1H and 15M: Where the Tension Shows Up
Meanwhile, the hourly chart is where things get murkier. $XRP is trading at 1.40, but its EMA20 (1.41), EMA50 (1.41), and EMA200 (1.40) are all bunched together in a tight cluster. There is no separation, no trend to speak of. RSI at 41.01 leans mildly bearish, and MACD has flatlined completely at zero across line, signal, and histogram.
The Bollinger Bands on the hourly are equally telling: mid at 1.41, upper at 1.43, lower at 1.40 — an extremely narrow range reflecting a market that has stopped moving in any meaningful way. This is consolidation, not conviction, and the hourly regime is officially tagged neutral.
Drop down to the 15-minute chart and the picture tilts more clearly negative. Price at 1.40 is now trading below its EMA20 (1.40), EMA50 (1.41), and EMA200 (1.41), with RSI at 43.25 and MACD flat again. The system explicitly flags this timeframe as bearish.
Here is the tension in full view: the daily structure still favors buyers, the hourly is neutral and going nowhere, and the 15-minute is quietly leaning bearish. That is not a clean trade setup. It is a market caught between a longer-term uptrend and short-term hesitation, and traders need to respect both sides rather than pick the story that fits their bias.
Bullish Scenario
The bull case for $XRP rests on the daily EMA stack holding. If price can reclaim the daily pivot at 1.41 and push through resistance at 1.42, that would start to resolve the MACD stall in favor of buyers, especially with RSI still holding above 55. A move back above the 1H EMA cluster near 1.41 would also flip the shorter-term picture, aligning it with the daily bias instead of fighting it.
What invalidates this scenario is simple: if price loses the daily support at 1.38 and breaks below the 1.35 daily EMA20, the bullish structure that has been holding since the recovery from the 1.25 EMA50 area starts to crack. At that point, the daily regime risks flipping from neutral-bullish to something more fragile.
Bearish Scenario
The bearish case leans on what is already visible on the 15-minute chart bleeding upward. If the hourly RSI keeps drifting below 40 and price fails repeatedly at the 1.41 pivot, that persistent rejection could drag the daily MACD histogram deeper negative, turning the current stall into an outright bearish cross.
Combine that with the broader market backdrop — a 3.12% drop in total crypto market cap and $BTC dominance at 59.12% — and $XRP could simply get starved of the capital rotation it needs to break higher. This scenario gets invalidated if price reclaims and holds above the daily EMA20 at 1.35 with RSI pushing back toward 60, confirming buyers stepping back in exactly where the structure needs them.
Positioning and Risk
Right now, the Ripple price today reflects a market at a decision point rather than one with a clear directional edge. The daily chart’s EMA stacking still favors the bulls on a structural basis, but the flattening MACD and the outright bearish tilt on the 15-minute chart mean momentum has not confirmed that structure yet.
Daily ATR of 0.08 says volatility is still present even during this apparent lull, so sharp moves in either direction should not be a surprise. With the Fear & Greed Index reading 71 (Greed) against a backdrop of a 3.12% drop in total market capitalization, there is a real disconnect between sentiment and price action across the broader market. $XRP sits right in the middle of that contradiction.
Anyone watching this setup should treat the 1.38–1.42 zone as the range that decides the next real move, and size their expectations around the fact that both the bullish and bearish cases are currently supported by real, conflicting evidence.
What is the Ripple price today and why is $1.40 significant?
As of September 7, 2026, $XRP trades at $1.40, a level that coincides with the daily Bollinger Band midline and sits just below the daily pivot point at $1.41, making it a key decision zone where bullish and bearish forces are currently balanced.
Are the daily EMAs still supporting a bullish outlook for $XRP?
Yes, price remains above the 20-period EMA (1.35), 200-period EMA (1.34), and 50-period EMA (1.25), maintaining a structurally bullish EMA stack on the daily timeframe. However, the flattening MACD suggests momentum has yet to confirm this structure.
What is causing the short-term bearish signals on $XRP?
The 15-minute chart shows price below all three EMAs with RSI at 43.25, while the hourly MACD has flatlined at zero — indicating a lack of short-term buying momentum despite the constructive daily structure. This divergence between timeframes creates the current tension.
Disclaimer: This article is for informational purposes only and does not constitute financial advice, an investment recommendation, or a solicitation to buy or sell any financial instrument or cryptocurrency. The analysis provided is not indicative of future results. Investing in crypto assets and financial markets carries a high risk of capital loss. Always do your own research (DYOR) and consult a qualified financial advisor before making any decision.
Article produced with the assistance of artificial intelligence and reviewed by the editorial team.
Source: cryptonews.net