


Reason to trust
Strict editorial policy that focuses on accuracy, relevance, and impartiality
Created by industry experts and meticulously reviewed
The highest standards in reporting and publishing
Strict editorial policy that focuses on accuracy, relevance, and impartiality
Morbi pretium leo et nisl aliquam mollis. Quisque arcu lorem, ultricies quis pellentesque nec, ullamcorper eu odio.
The on-chain analytics firm Glassnode has highlighted the $97,000 to $98,000 zone as an important one for Bitcoin. Here’s why.
Bitcoin CBD Suggests Build Up Of Supply In This Range
In a new post on X, Glassnode has discussed about a potentially significant zone for Bitcoin based on the Cost Basis Distribution. The Cost Basis Distribution (CBD) is an indicator that measures the amount of the BTC supply that investors last purchased or transferred at the various price levels.
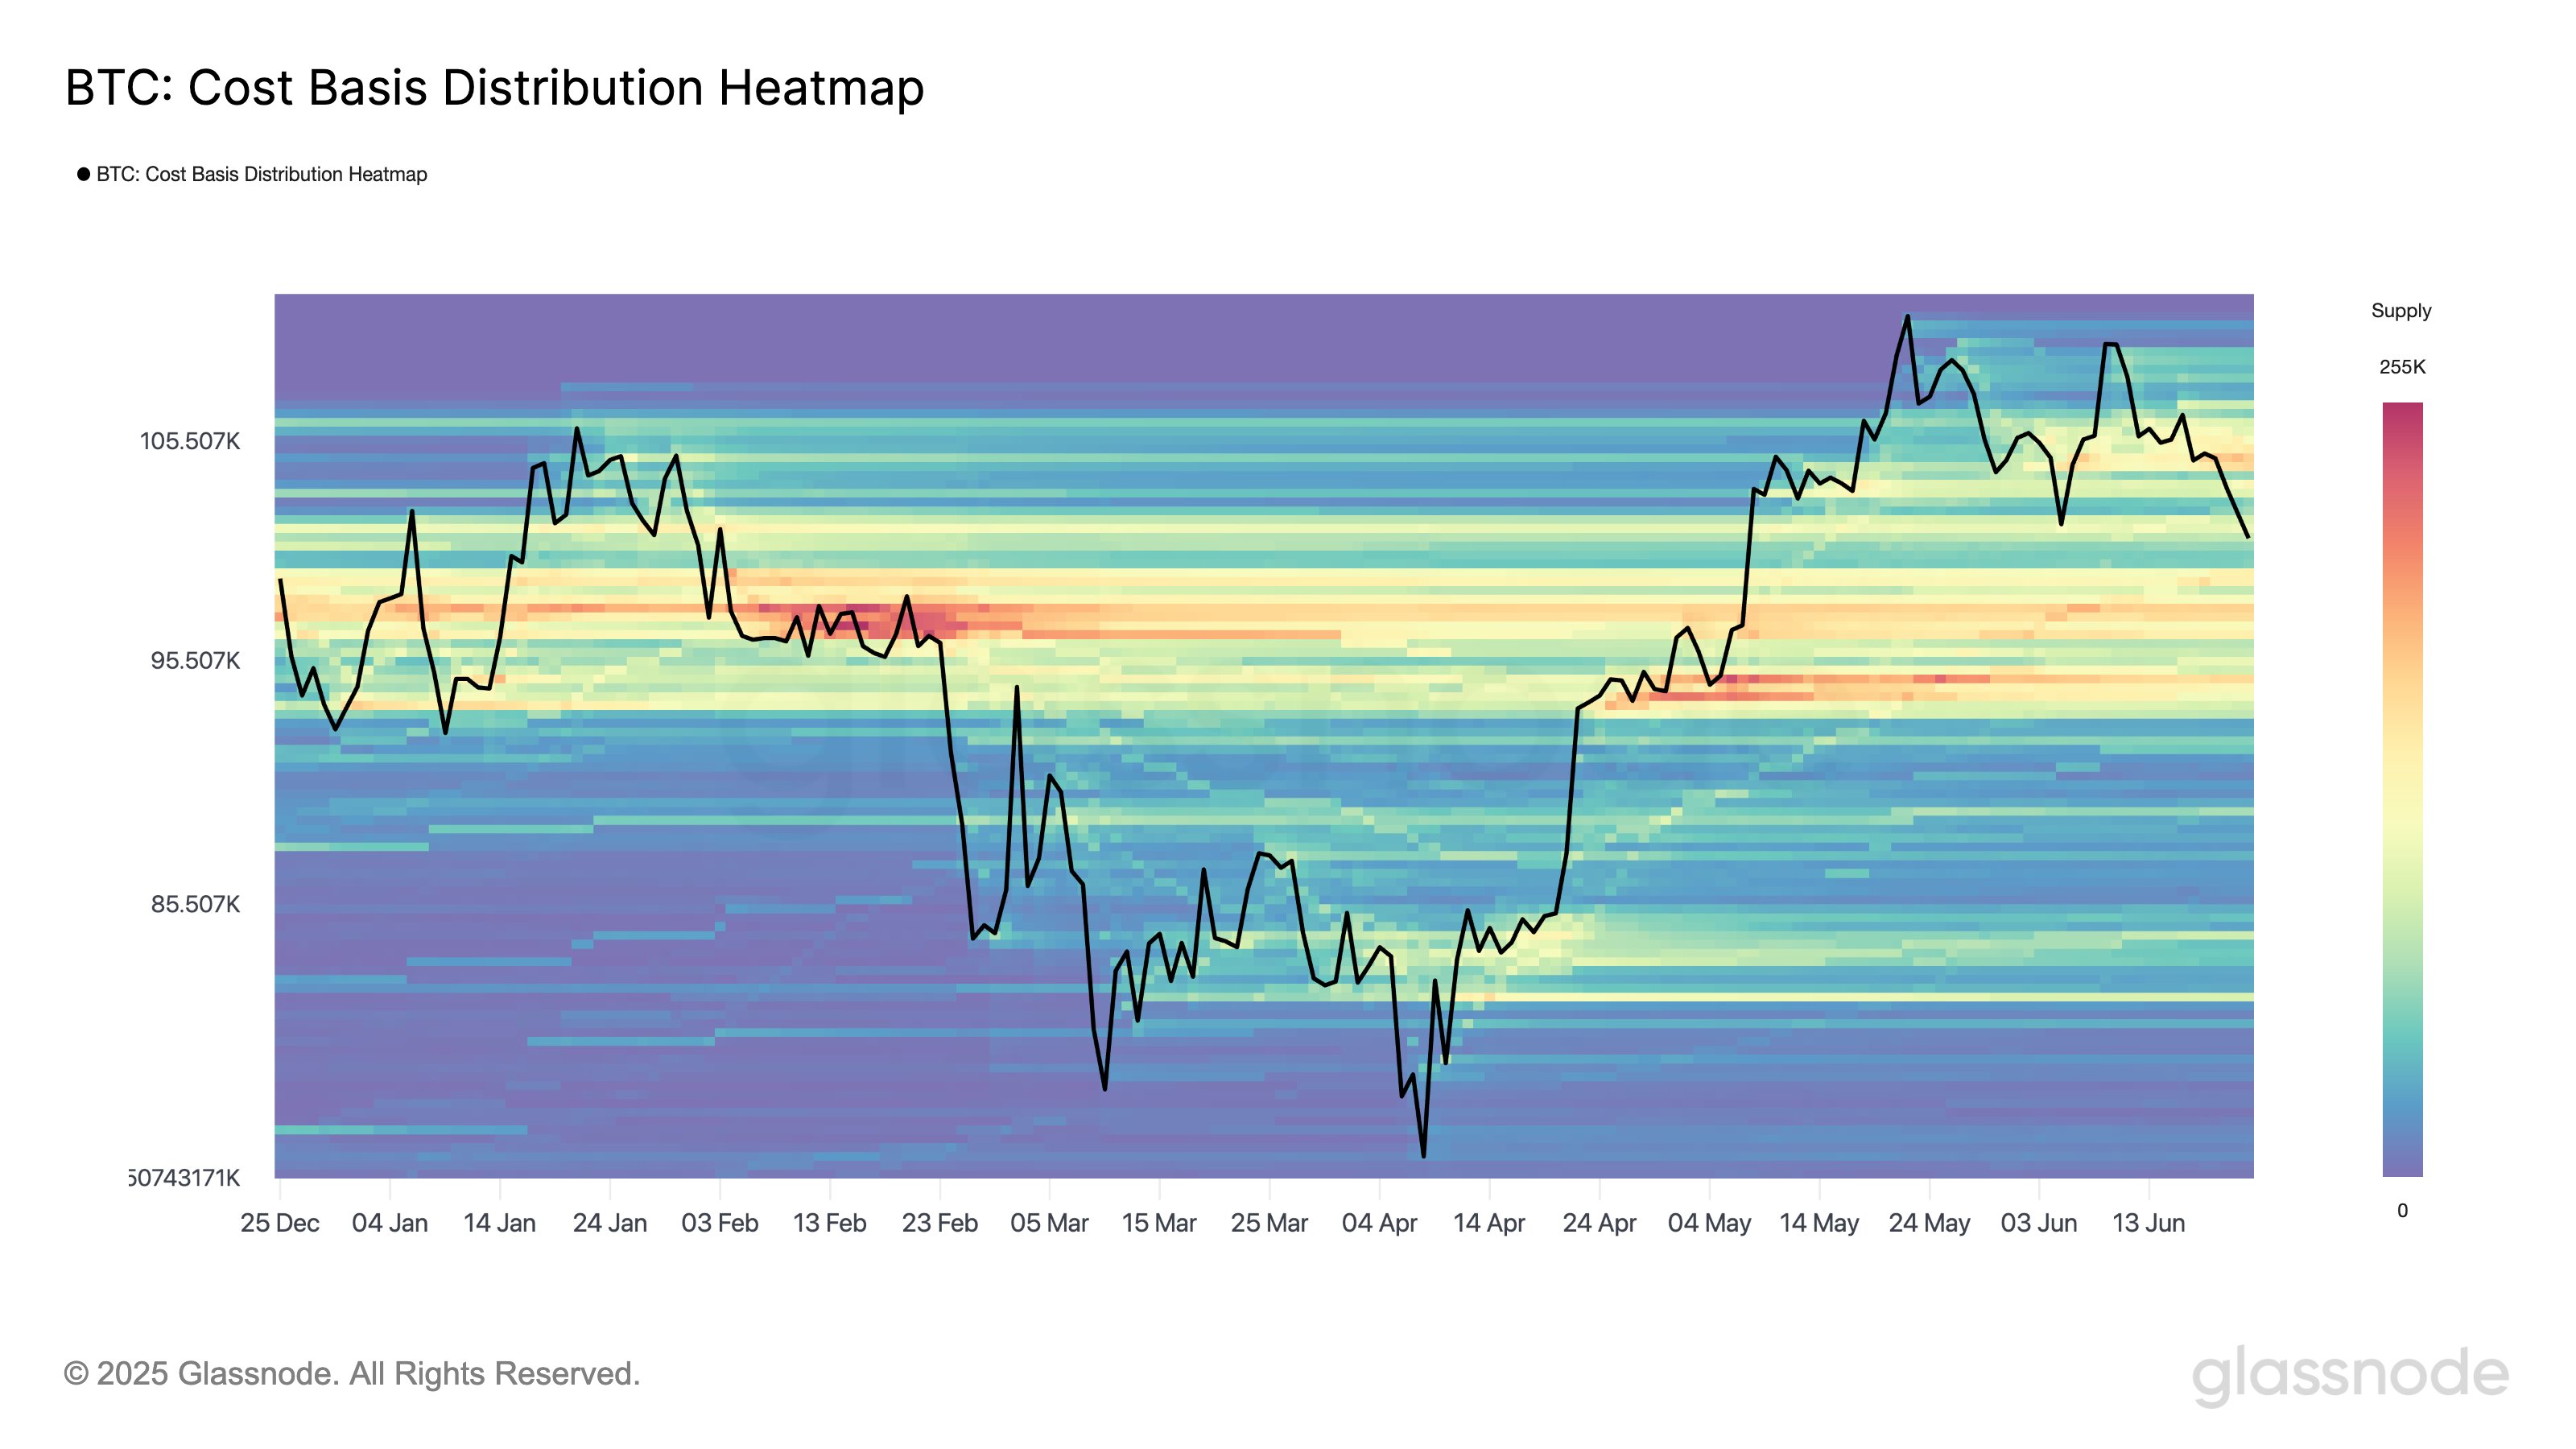
As is visible in the above graph, there is a dense supply zone located between $97,000 to $98,000. Generally, investors are quite sensitive to retests of their cost basis, so a large amount of them (or alternatively, a few large holders) having their acquisition level inside a narrow range could make retests of it significant for Bitcoin.
Related Reading
When the mood in the market is bullish, holders can react to retests of their cost basis from above by buying more. They may do so believing that the same level would end up proving profitable again in the future and the retrace is just a ‘dip.’
The cryptocurrency suffered a plunge yesterday and nearly touched this region. Since then, however, things have turned around for the asset and it has gained some distance over it once more.
In the event that the decline does continue, which may not be too unexpected given the volatile geopolitical situation at the moment, the zone could end up acting as the next true pivot for Bitcoin, according to the analytics firm.
While the CBD tells us where the cryptocurrency’s supply is concentrated, it doesn’t contain any information about who bought or sold at those price levels. Glassnode’s behavioral cohorts, investor groups divided on the basis of their behavior, solve this problem.
Here is a chart that shows the trend in the Bitcoin supply held by these holder cohorts over the past few years:
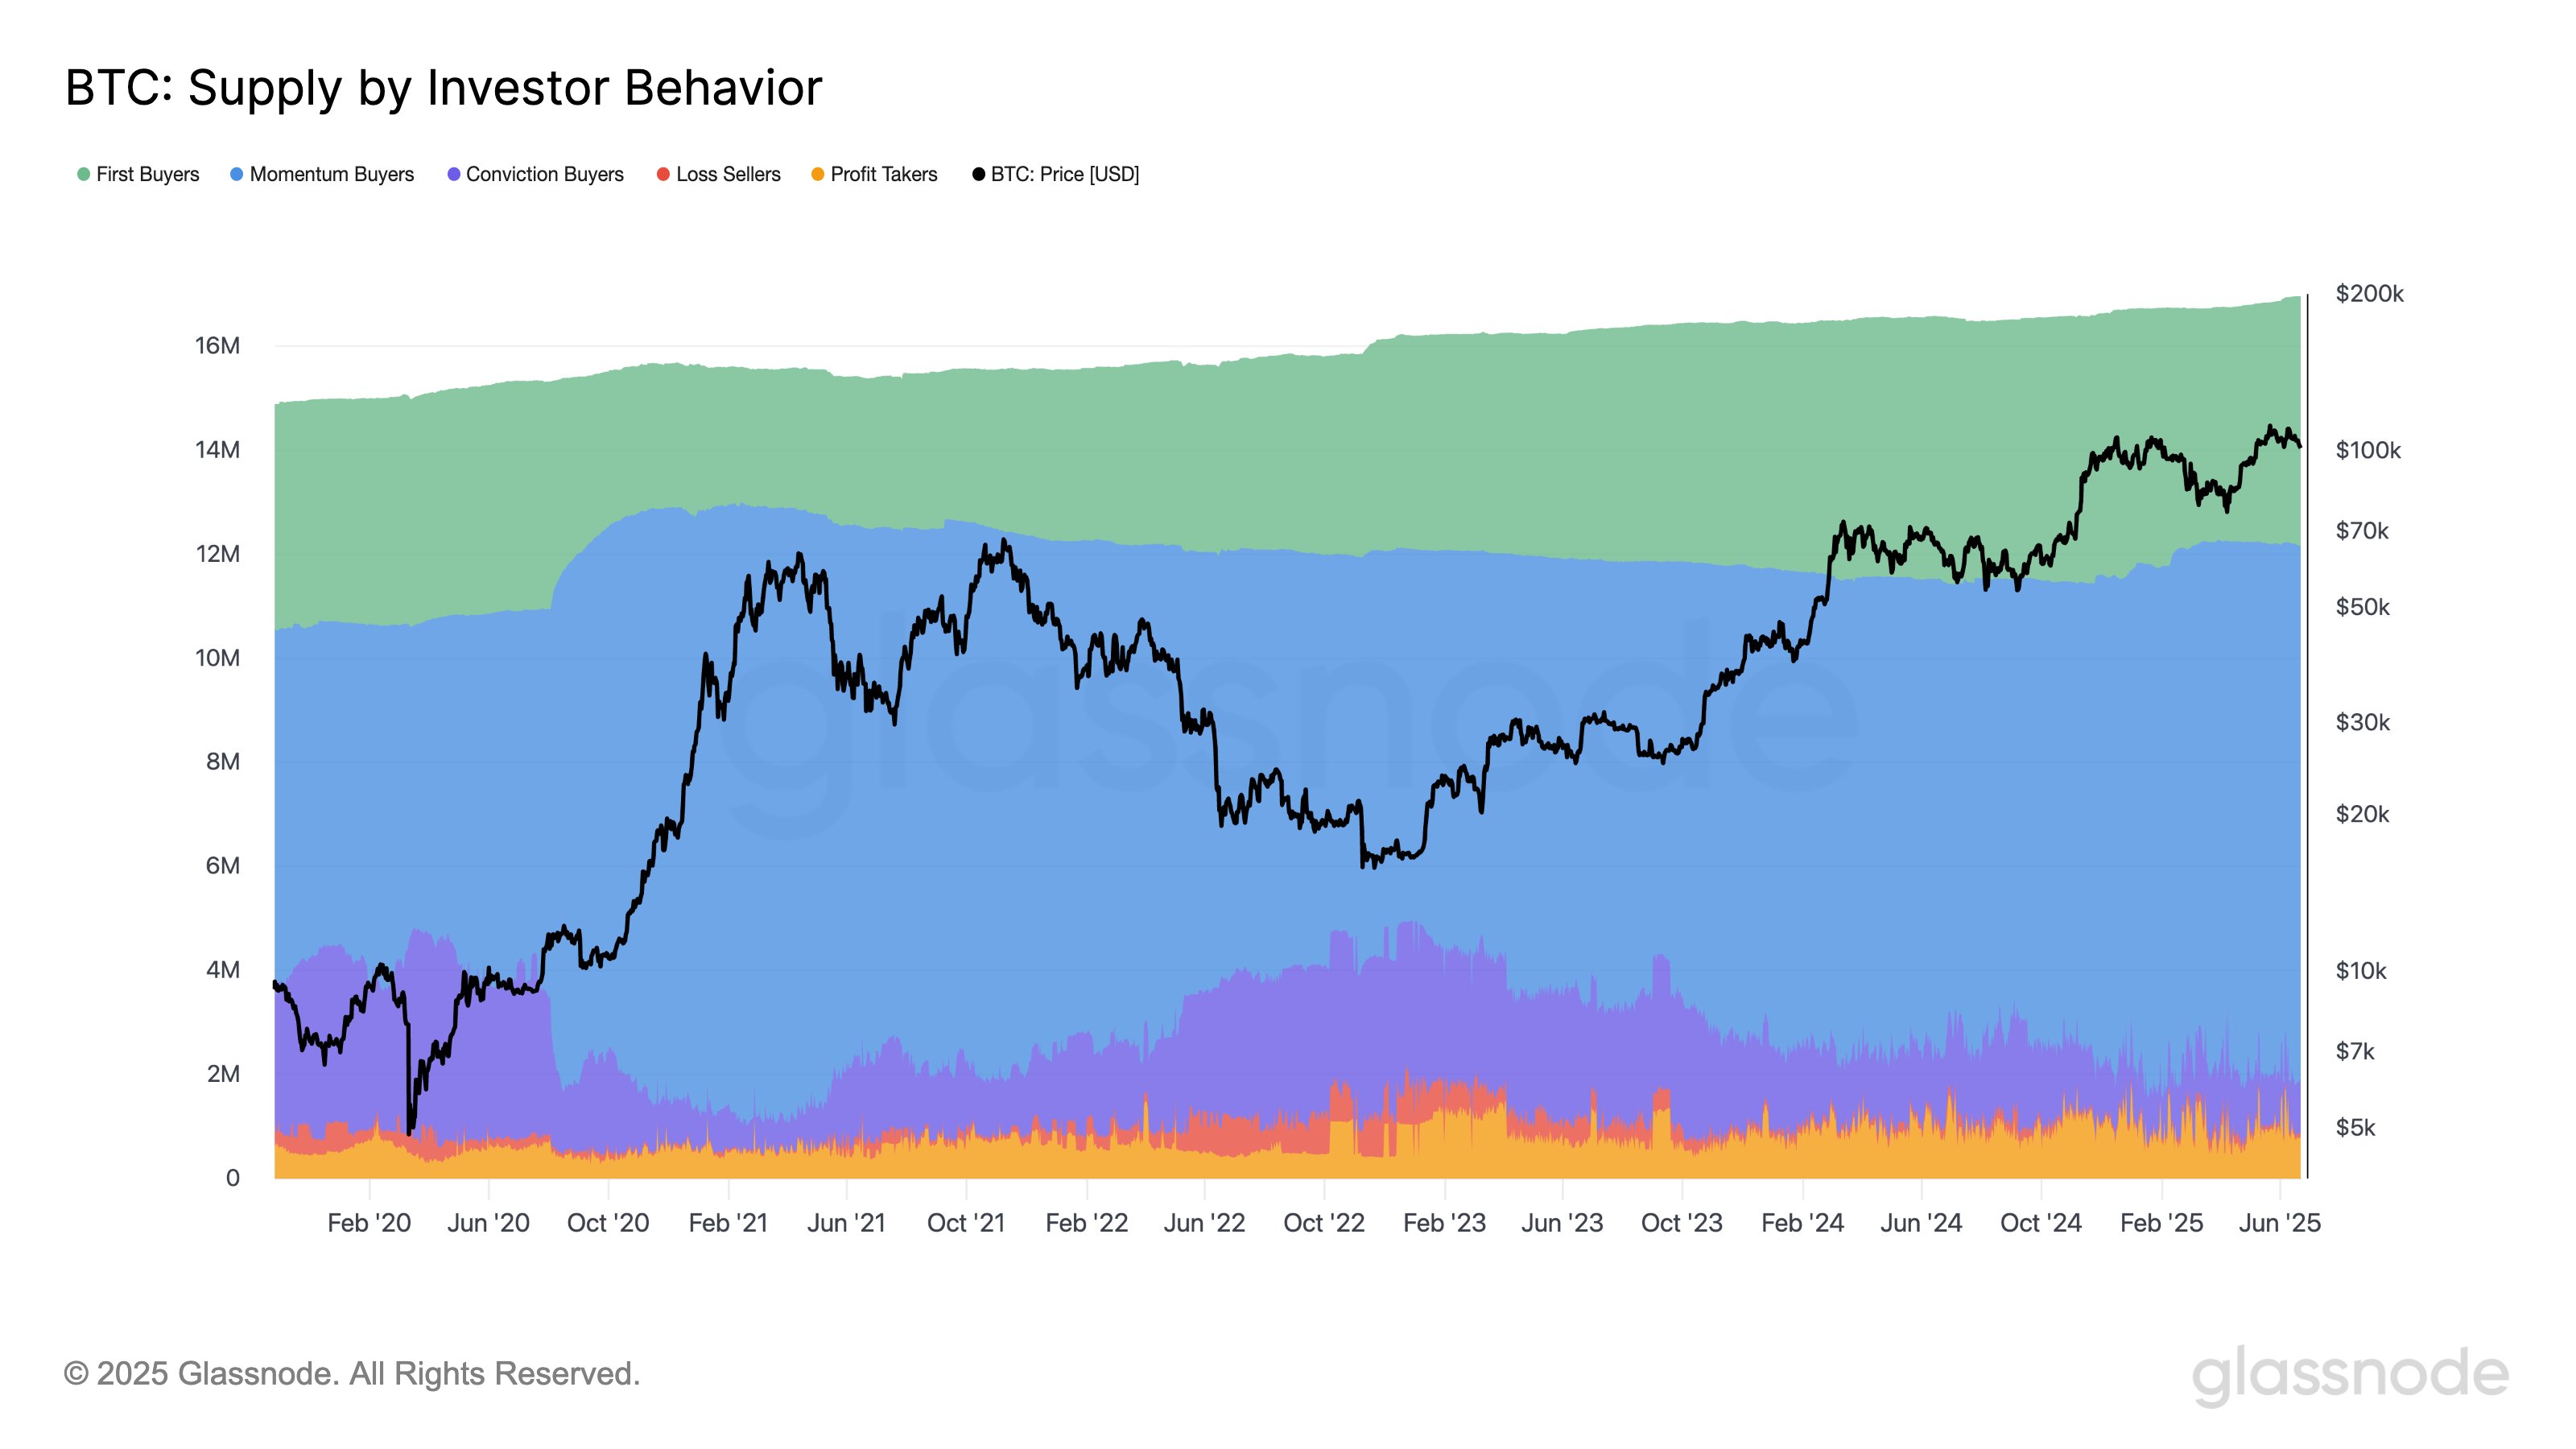
There are five of these behavior groups. First Buyers (green) include the investors who are buying Bitcoin for the very first time. As displayed in the chart, the supply of this group has been on the rise, indicating fresh demand has been coming in.
Momentum Buyers (blue) are those that capitalize on market momentum by buying during uptrends. On the opposite spectrum are the Conviction Buyers (purple), who buy despite falling prices.
Finally, there are the Loss Sellers (red) and Profit Takers (yellow), who correspond to investors exiting at a loss and profit, respectively. During the past couple of weeks, the former cohort has seen an increase of 29%, a sign that weak hands have been capitulating.
Related Reading
That said, the analytics firm has noted, “Conviction Buyers also increased, suggesting sentiment isn’t collapsing. Some are cutting losses – others are actively lowering their cost basis.”
BTC Price
At the time of writing, Bitcoin is floating around $103,900, down more than 4% in the last seven days.

Featured image from Dall-E, Glassnode.com, chart from TradingView.com

