


Don't want to trade it yourself?
Our desk runs DEX portfolios on profit share.
Currencies39037
Market Cap$ 2.78T+0.57%
24h Spot Volume$ 26.25B-40%
DominanceBTC57.41%-0.58%ETH10.84%+0.39%
ETH Gas0.05 Gwei
MarketAltcoinHyperliquidHype
Sep 5, 2026
2min read
bySarayu Krishna
forTheNewsCrypto

Hyperliquid (HYPE) token trades around $84 (session range $83.64–$87.31) after a 1.6% 24h dip, with market cap about $18.75B and 24h volume near $1.164B as the global crypto market cap slips to $2.77T (-1.2%). Technicals indicate short-term weakening — MACD below its signal but above zero and RSI at 52.79 — with immediate support near $83.68 and downside risk toward ~$82 if a death cross occurs, while a bullish reversal could target $85–$86.12; baseline trend is still overall bullish.
See what traders are focused on
- Hyperliquid is currently trading at around $84.
- HYPE’s baseline trend remains overall bullish.
The global crypto market cap is settled at $2.77 trillion, after a 1.2% loss. In line with this, Hyperliquid (HYPE) has posted a modest 1.6% drop in value over the last 24 hours. Moreover, the session’s range falls between $83.64 and $87.31. The asset could have tested key price ranges to confirm the current momentum.
If the bears stay for a longer period, the price could see more downside. At the time of writing, Hyperliquid traded at around the $84.61 mark, with its market cap at $18.75 billion. Besides, the daily trading volume has reached the $1.164 billion zone, as per CoinGecko data.
Zooming in on the recent price chart, there is a bearish trait within the pattern. The Hyperliquid momentum could drop to the support at $83.68 if the bears stay stronger. An extended, powerful downside correction might trigger the death cross to take place and send the price even lower, around $82.
On the flip side, assuming Hyperliquid turns for a bullish reversal, the price could jump and find the nearest resistance within the $85 range. With the potential upside pressure strengthening, the golden cross could likely unfold and push the asset’s price upward, above the $86.12 level.
Hyperliquid’s Technical Chart Points to a Weakening Trend
The technical analysis reports that the Moving Average Convergence Divergence line is below the signal line. Both lines remain above the zero line, signalling a bullish uptrend that is experiencing short-term weakening. The baseline trend of Hyperliquid remains overall bullish.
It reflects an established uptrend in the broader market structure, with the short-term momentum slowing down. When the MACD line crosses below its signal line, it creates a bearish crossover. Also, the price might be forming a flag pattern, consolidating sideways before resuming the broader upward trend.
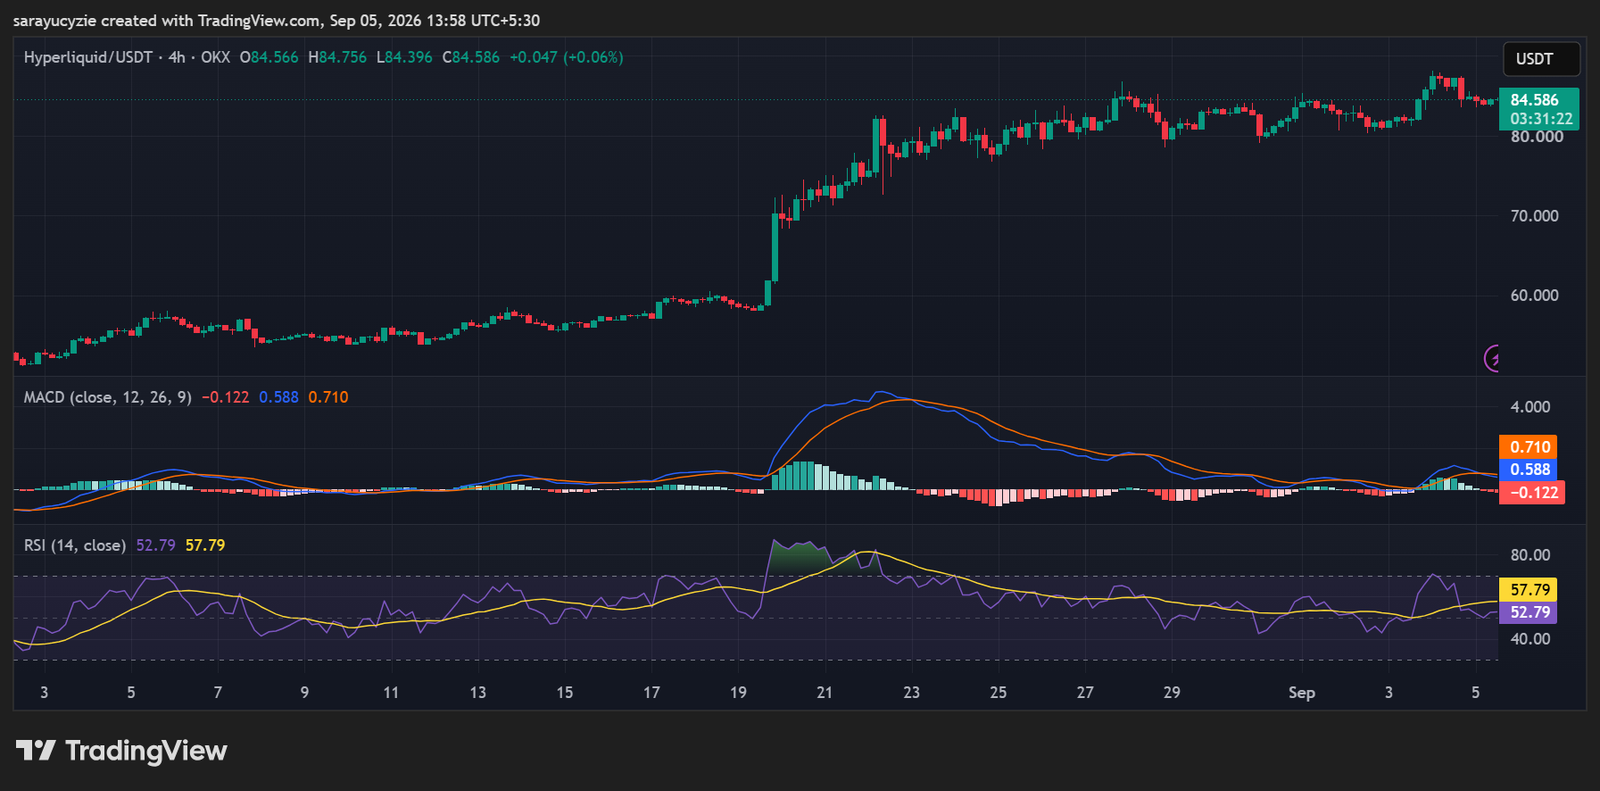
Hyperliquid’s daily Relative Strength Index of 52.79 is in the neutral territory, with a subtle bias toward bullish momentum. It is in equilibrium, with neither buyers nor sellers exercising dominant control over the price. This is high enough to confirm strong momentum; it is either consolidating sideways before its next directional move.
Price is moving within a horizontal range while the momentum decides on a direction. Following an active rally or sell-off, price is taking a breather to cool off before continuing the primary trend. If RSI recently crossed upward from below 50, it suggests momentum is slowly shifting from sellers to buyers.
Source: cryptorank.io