

Don't want to trade it yourself?
Our desk runs DEX portfolios on profit share.
BT
BTC SPOT
BTC
LIVE
—
—
BTC is moving with elevated volatility. Track the live chart before deciding what comes next.
Track BTC in real time
Open an account
Market data delayed. Not investment advice. Crypto-assets are highly volatile.
eToro is a multi-asset investment platform. The value of your investments may go up or down. Your capital is at risk. Crypto CFDs are not available to FCA / UK users.
<a href="https://xpertsstudio.com/bitcoin-rallies-5-as-fed-governor-waller-signals-rate-hold/” title=”Bitcoin Rallies 5% as Fed Governor Waller Signals Rate Hold”>Bitcoin’s Rally Meets Resistance After ETF-Fueled Surge
Bitcoin (BTC) has been on a rollercoaster this week, surging above $82,000 on September 3, 2026, before retreating below the psychologically critical $80,000 mark the next day. The catalyst behind this volatility was a massive wave of institutional demand, with U.S. spot Bitcoin ETFs recording a net inflow of $731 million on September 3 — the largest single-day inflow since January 2026. BlackRock’s iShares Bitcoin Trust (IBIT) led the charge, accounting for $454 million of these inflows.
This surge in ETF demand triggered a significant short squeeze, liquidating nearly $250 million in short positions across crypto markets and pushing Bitcoin’s price temporarily above $82,000. However, the momentum proved fragile as a stronger-than-expected U.S. August jobs report on September 4, showing 162,000 jobs added versus a 53,000 consensus, sparked fears of a Federal Reserve interest rate hike at the upcoming September 15-16 meeting. This macroeconomic development reversed some of the gains, dragging Bitcoin below $80,000 and wiping out $295 million in long positions.
Technical Setup: Testing Resistance Near $79,700
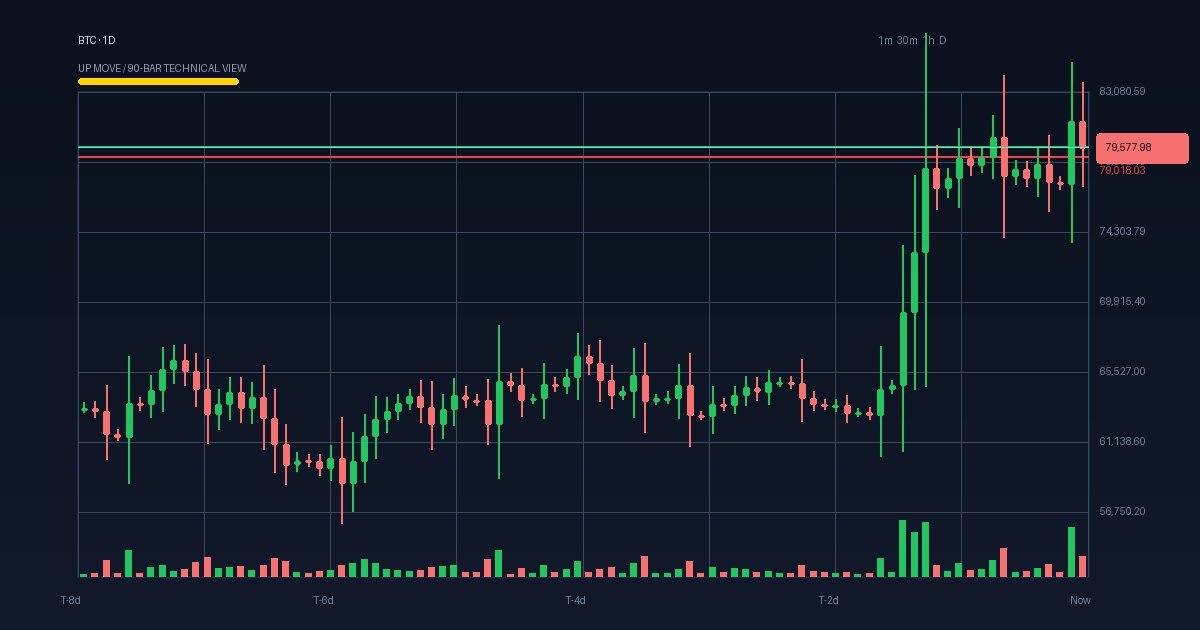
Currently, Bitcoin trades around $79,578, reflecting a -1.41% change over the last 24 hours, and hovering just below a key resistance level at $79,671.26. The 14-day Relative Strength Index (RSI) stands at a healthy 66.14, indicating strong but not overextended momentum. Volume is notably elevated at 2.48 times the 30-day average, underscoring active participation in this price move.
Key moving averages reinforce the uptrend: the 20-day simple moving average (SMA20) sits at $75,601, well below the current price, while the 50-day and 200-day SMAs are clustered near $68,774 and $69,601, respectively. The 20-day exponential moving average (EMA20) at $75,669 also supports the bullish bias.
Support lies just below at $79,018, about 0.7% below spot, providing a tight floor for traders to watch. A sustained break above the $79,730-$79,920 zone is critical for confirming a clean bullish continuation, as noted by crypto analyst Ali Charts. Holding above $80,600 could pave the way for a run toward $85,000, but failure to clear resistance risks a pullback.
Volume and Momentum: Strength or Short-Covering Bounce?
Market volatility creates opportunities. Do not let the next big move pass you by open your premium trading account today and get access to real-time data, zero-commission trades, and advanced analytical tools.
The surge in volume accompanying Bitcoin’s recent rally is a double-edged sword. While institutional inflowson short covering tempers confidence. Nearly $250 million in short liquidations on September 3 artificially inflated price gains, and the subsequent $295 million long liquidation on September 4 highlights the market’s sensitivity to macro shifts
Without sustained spot-led buying beyond ETF inflows, the rally risks being a transient squeeze rather than a structural reversal. Elevated leverage in the market further exposes Bitcoin to sharp moves if ETF demand slows or macroeconomic headwinds intensify.
Macro Risks: Fed Rate Hike Looms
The stronger U.S. jobs report has increased market expectations for a Federal Reserve interest rate hike at the mid-September meeting. Historically, rate hikes pressure risk assets like Bitcoin, as higher yields make alternative investments more attractive and tighten liquidity.
This macro backdrop complicates Bitcoin’s technical picture. Adding to these concerns, historically, September has been a challenging month for Bitcoin, with an average return of approximately -3% since 2013, presenting a seasonal headwind to the current price action. The market’s reaction to the jobs report — a swift pullback and liquidation of long positions — suggests traders are wary of betting heavily on a sustained rally until the Fed’s policy direction is clearer.
Scenario Map: What Traders Should Watch
| Scenario | Condition | Invalidation | Timeframe |
|---|---|---|---|
| Bullish Breakout | Sustained close above $79,920, holding $80,600 support | Close below $79,000 support | 1-2 weeks |
| Consolidation | Price oscillates between $79,000 and $79,920 | Breakout or breakdown | Several days |
| Correction | Close below $79,000 with increased volume | Reclaim above $79,671 resistance | 1-2 weeks |
Trading Plan and Risk Management
Given the elevated volume and momentum, traders should approach Bitcoin with a balanced strategy. Entry on a confirmed breakout above $79,920, ideally supported by ETF inflows and positive macro signals, offers a favorable risk-reward toward $85,000. Conversely, stops below $79,000 can help limit downside if the macro environment worsens or ETF demand fades.
For those looking to buy Bitcoin, comparing broker access and fees is essential. Platforms like eToro offer competitive spreads and user-friendly interfaces suitable for both new and experienced traders.
Key Levels at a Glance
| Level | Price (USD) | Distance from Spot | Implication |
|---|---|---|---|
| Resistance | $79,671.26 | +0.12% | Immediate barrier to overcome for bullish continuation |
| Support | $79,018.03 | -0.7% | Key floor to hold to avoid deeper correction |
Final Verdict
| Posture | Key Level | Invalidation | Next Trigger | Confidence |
|---|---|---|---|---|
| Neutral-Bullish | Break above $79,920 | Drop below $79,000 | Fed meeting outcome and ETF inflows | Moderate; reliant on macro and spot demand |
What to Watch Next
The Federal Reserve’s September 15-16 meeting will be a pivotal event for Bitcoin’s near-term trajectory. Market participants should also monitor ETF inflows in the coming days to gauge whether institutional demand sustains or wanes. A decisive move above $80,600 would signal renewed strength and open the door to $85,000, while failure to hold support near $79,000 could invite a deeper pullback.
Why did Bitcoin spike above $82,000 recently?
The spike was driven by a record $731 million inflow into U.S. spot Bitcoin ETFs on September 3, 2026, led by BlackRock’s IBIT, combined with a short squeeze liquidating nearly $250 million in short positions.
What caused Bitcoin’s pullback below $80,000?
A stronger-than-expected U.S. jobs report on September 4 increased expectations for a Fed rate hike, triggering $295 million in long liquidations and a price retreat below $80,000.
What technical levels are critical for Bitcoin now?
Resistance near $79,671 and the $79,730-$79,920 zone must be cleared for bullish confirmation. Support around $79,018 is key to prevent a deeper correction.
How does ETF inflow affect Bitcoin’s price?
ETF inflows represent institutional spot demand, which can underpin price gains. However, the recent rally’s reliance on short covering means sustained spot-led buying is necessary for a stable uptrend.
Where can I buy Bitcoin with competitive fees?
Platforms like eToro offer accessible options with competitive spreads and user-friendly features.
Sources
- The Cryptonomist: U.S. Bitcoin ETF Inflows Surge $731M on September 3
- PrimeXBT: Bitcoin Spikes Past $82,000 as Short Squeeze Triggers $250 Million in Liquidations
- Bitcoin.com News: Bitcoin Price Rally Collapse Wipes Out $295M in Long Positions
- InvestingLive: Bitcoin Price Analysis September 2026: Bulls Need 78,340 to Confirm the Reversal
A useful background piece for this story is Crypto Exchanges.
Readers who want the wider market context can also use What is Bitcoin.
AI
Market signal
BTC (BTC)
Trade BTC with live price context
—
—
Open on eToro ↗
Was this helpful?
0 found this helpful · 0 did not
Thanks for your feedback.
Disclaimer. This content is for informational and educational purposes only. It does not constitute financial advice, a recommendation, or an offer to buy or sell any security or digital asset. Past performance does not guarantee future results. Cryptocurrency investments are subject to high market risk and volatility.
Source: www.interactivecrypto.com
3 Comments
Pingback: Coinbase Files With SEC To List 24/7 Equity Perpetual Futures in US – xpertsstudio
Pingback: Ethereum Price Breaks $2,500 Resistance as ETH Community Weighs 35 New Products | Analysis Ethereum – xpertsstudio
Pingback: Bitcoin Falls Below $80K as Hot Jobs Report Revives Fed Hike Bets – xpertsstudio