

Don't want to trade it yourself?
Our desk runs DEX portfolios on profit share.
Over the last hour, bitcoin’s price stood between $78,400 to $78,743 per coin on Thursday morning, up 2.5% over 24 hours as buyers defended a crucial support area while resistance near $79,000 and higher continued to slow the recovery. In the volatile land of wild bitcoin prices, the Sept. 3 setup remains range-bound inside a broader upswing, leaving the seven-day low of $76,229 and resistance of roughly $79,000 above as the immediate levels that could determine what comes next.
WRITTEN BYAbhinav Jain
SHARE
Published:Sep 3, 2026, 9:40 AM EDT
Key Takeaways
- Bitcoin’s price rose 2.5% on Sept. 3 while holding above the key $76,229 support level.
- Bitcoin’s 13 moving-average buy signals contrast with 2 oscillator sell readings.
- Bitcoin’s price needs to clear $79,000, with $81,300 marking the next major resistance.
Bitcoin’s 1-Hour Chart Keeps the Breakout on Hold
The 1-hour chart shows bitcoin’s price logging a choppy grind higher after touching $76,229, with the rebound running into a liquidity pocket around $78,500. Candles have been mixed, while volume has remained below levels seen during the Sept. 2 selloff.
A local high reached $78,743, but the latest action stalled beneath that level. Interestingly, the rebound is visible without providing the volume confirmation normally associated with a clean breakout.
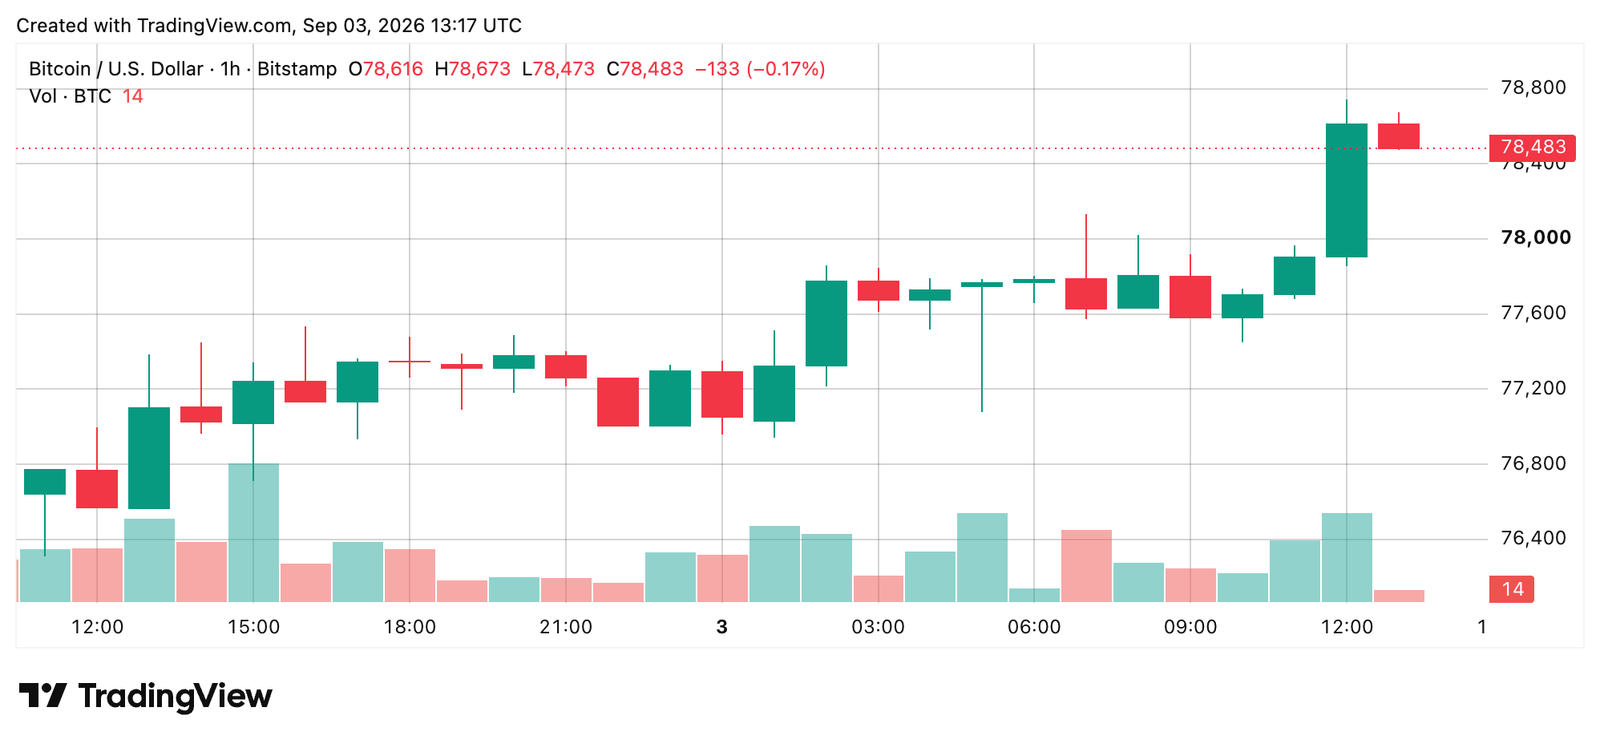
The short-term map, therefore, remains fairly tight. Holding $77,500 to $77,600 keeps the long-side context intact, with $79,000 to $80,000 serving as an area to scale out. On the flip side, a break below $77,500 accompanied by expanding volume would put a retest of $76,229 in the cards. No clean 1-hour breakout exists, while bitcoin’s price remains pinned below Thursday’s $78,743 swing high.
Bitcoin’s 4-Hour Recovery Rebuilds Ground After the Flush
The 4-hour bitcoin price chart tells a similar story over a wider window. Bitcoin was rejected from $78,389, dropped to $76,229 and then recovered toward the $77,700 to $78,100 zone, reaching an intraday high of $78,743 today. That move forms a flush-and-reclaim pattern, essentially a sharp drop followed by a recovery of lost ground. The bounce has higher lows, but recovery volume has not been as strong as volume during the decline, limiting evidence for a fresh trend leg.
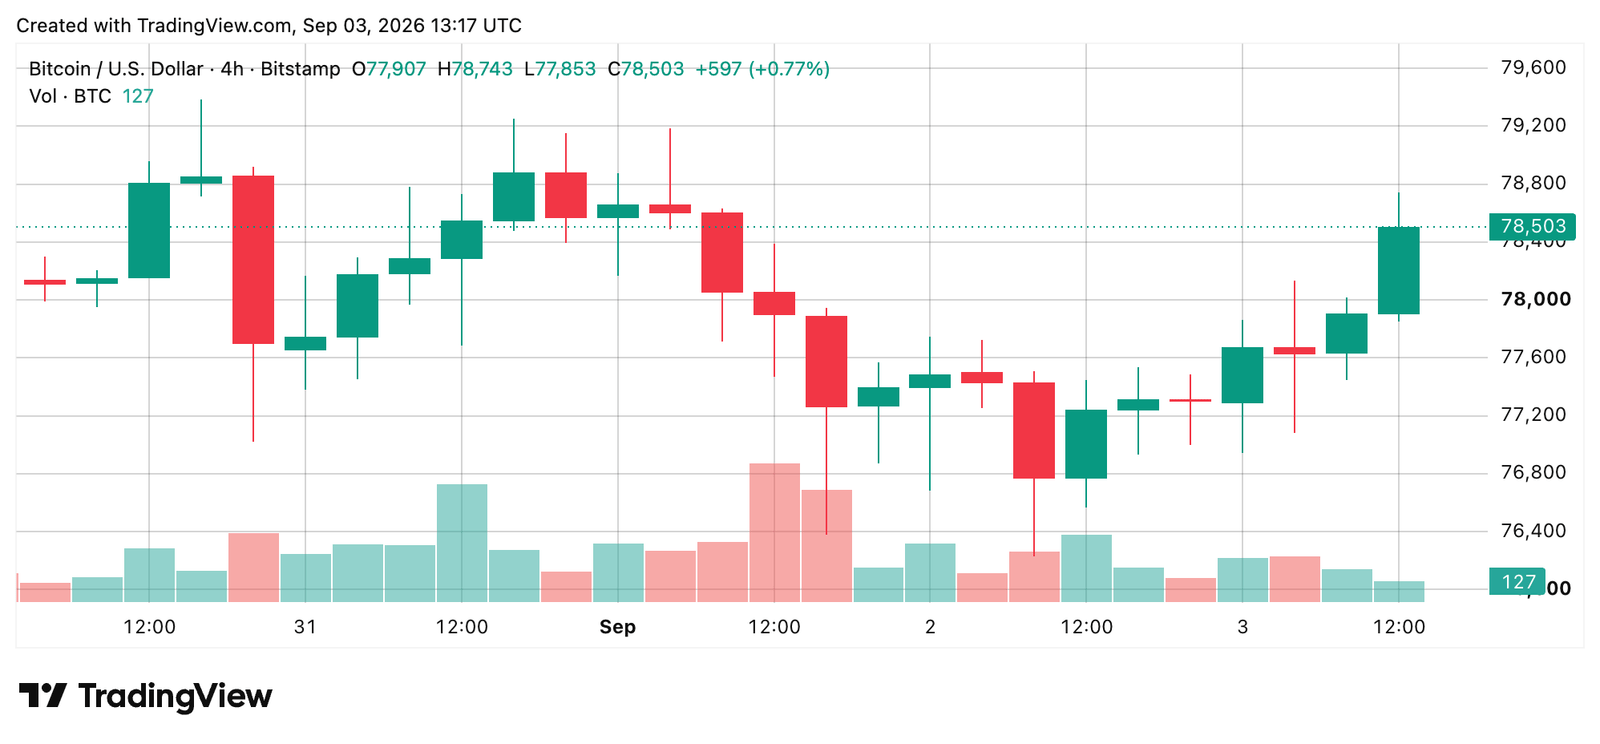
Strength above the $77,000 to $77,400 reclaim zone supports the recovery context, while $76,500 to $76,900 represents a secondary support area as long as $76,229 remains intact. At the moment, resistance sits first around $78,900 to $79,000, followed by $79,200 and then $81,280 per unit. On the other hand, a 4-hour bitcoin price close below $76,229 per coin would invalidate the recovery structure and reopen the downside.
Bitcoin’s Daily Structure Preserves the August Upswing
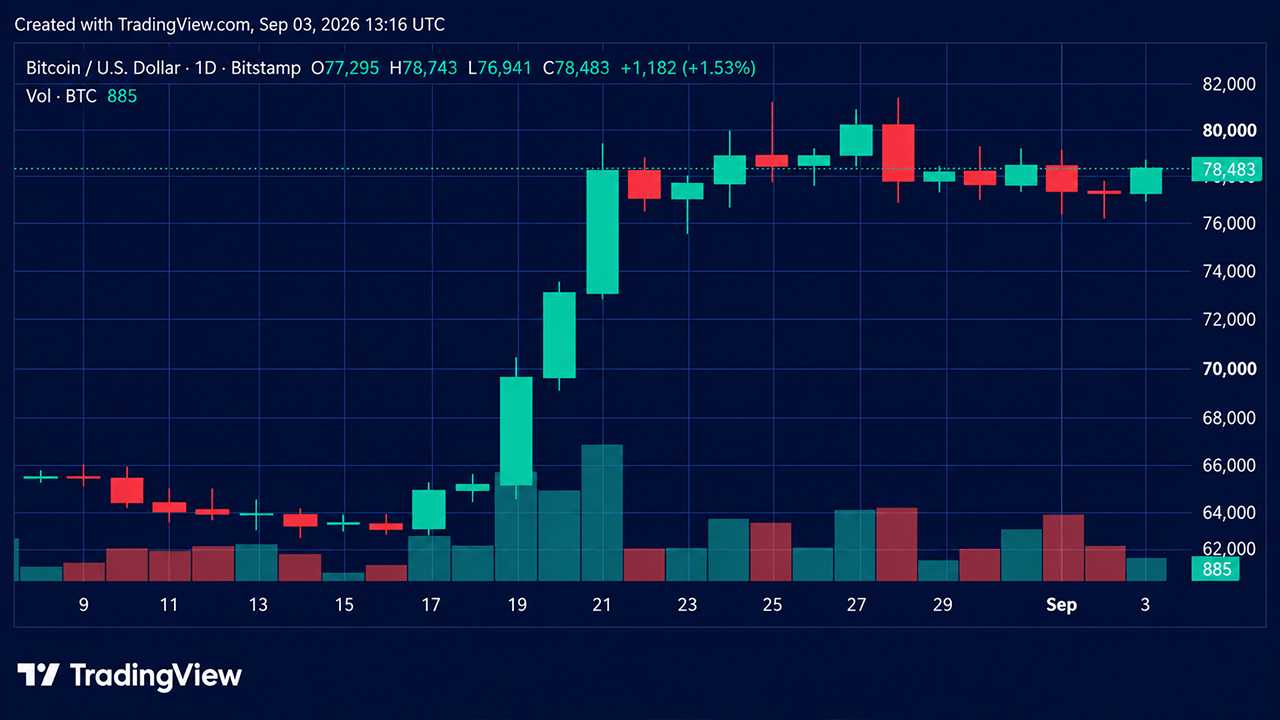
The daily bitcoin price chart provides a great deal of context for the crazy bitcoin market that has shown itself over the last month. After advancing from an August baseline of around $62,216 and reaching roughly $81,455, bitcoin entered a period of consolidation. The seven-day range stands at $76,297 to $81,281, leaving the price in the middle-to-upper portion of that band. The structure remains constructive while daily closes hold around $76,300 to $76,900, but bulls have not reclaimed the late-August highs.
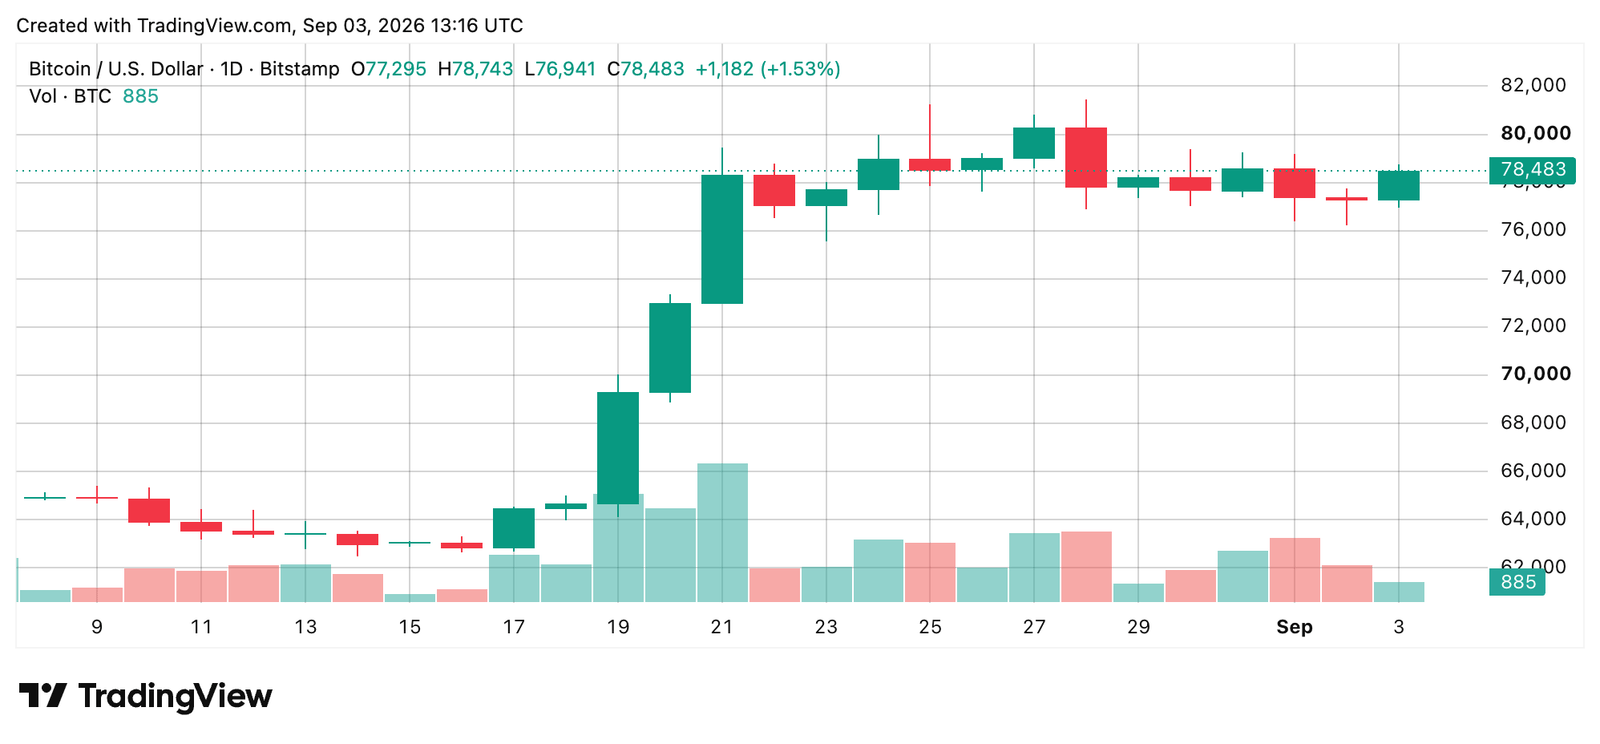
A daily close above roughly $81,280 would mark the upside trigger identified in bitcoin’s price trend. A close below approximately $76,230 to $76,300 would instead weaken the structure and reopen lower areas around $74,600 and then $71,000 to $72,900. That makes the current range significant because neither side has produced the decisive break needed to establish the next directional move.
Oscillators Show Momentum Has Not Fully Joined the Rally
The daily chart’s oscillator summary is neutral, clocking some sell signals, a group of neutral readings, and no bullish signals. The relative strength index (RSI) is 67, below the classic overbought threshold of above 70. The Stochastic oscillator stands at 68, the commodity channel index (CCI) is 42, the average directional index (ADX) is 43, and the Awesome oscillator (AO) is 7,769, with all five rated neutral.
Momentum (MOM) at minus 999 and the moving average convergence divergence (MACD) level at 3,234 are the two oscillators carrying bearish readings. The average directional index (ADX) standing at 43 indicates a trend is present rather than a dead range. Taken together, the readings show why momentum alone has not confirmed the rebound even as bitcoin’s price has recovered a significant portion of the decline from the recent swing high.
Moving Averages Keep the Broader Technical Picture Bullish
Alongside this, the daily chart’s moving average (MA) tape tells a more bullish story, with a great deal of positive readings, one neutral state, and one bearish clocked reading. The exponential moving average (EMA) values for 10, 20, 30, 50, 100, and 200 periods are $77,320, $74,951, $72,928, $70,566, $69,365, and $72,387, respectively, and each carries a bullish signal on the 24-hour timeframe.
In the case of the simple moving average (SMA) readings for 10, 20, 30, 50, 100, and 200 periods, the tape stands at $78,287, $74,615, $71,102, $68,391, $66,252 and $69,555, respectively. Only the 10-period SMA carries a negative signal. Bitcoin is above every listed MA except that $78,287 level, leaving the longer 20-, 30-, 50-, 100- and 200-period stack aligned with other bullish readings.
For now, bitcoin remains range-bound inside the higher-timeframe advance, with $76,230 acting as critical support and $78,390 followed by $81,280 defining resistance. A confirmed move beyond those boundaries would change the technical picture. Until then, the evidence supports watching the range edges rather than treating the midrange rebound as a confirmed new leg, especially with oscillators neutral even as moving averages remain strongly bullish.
Bull Verdict
The bull case is pretty simple: Bitcoin’s price is still holding above the $76,229 must-hold level, while the longer moving-average stack is doing a great deal of the heavy lifting. If bulls can punch through $78,900 and higher and get acceptance above $79,500, a run toward $81,280 to $81,455 is likely in the cards. Interestingly, the bigger problem is momentum. The bounce is there, but volume has not exactly come roaring back. Currently, bulls have control of the bigger trend, but they still need to prove they can finish the job.
Bear Verdict
On the flip side, bears have a pretty clear opening if bitcoin’s price keeps getting smacked down around the $78,000 zone. The neutral oscillators, along with bearish readings from the MOM, and MACD, show the rebound is not firing on all cylinders. A significant break below $77,500 would put $76,229 back in play, and a 4-hour close beneath that floor could open a deeper move. On the other hand, bears are fighting a strongly bullish MA structure, so until $76,229 actually cracks, no one is calling for a major breakdown at this juncture.
French Hill Highlights CLARITY Act as 2026 Passage Odds Hit 15%
Prediction-market traders assign the CLARITY Act only a 15% chance of becoming law in 2026. House Financial Services Committee Chairman…
Tags in this story
Bitcoin (BTC)Bitcoin Pricemarkets and pricesTechnical Analysis
Source: news.bitcoin.com
1 Comment
Pingback: Bitcoin Pumps as Fed Signals Rate Pause, $415 Million in Shorts Get Rekt – xpertsstudio