


Don't want to trade it yourself?
Our desk runs DEX portfolios on profit share.
<img src="https://xpertsstudio.com/wp-content/uploads/2026/09/image-14.png" alt="<a href="https://xpertsstudio.com/augusts-crypto-market-winners-explode-as-september-danger-looms/” title=”August's Crypto Market Winners Explode as September Danger Looms”>Crypto market falls” loading=”lazy”>
MentionedBTC$77,356.00+0.02%ARB$0.122431+14.86%
The crypto market is pulling back on Wednesday, September 2, as renewed U.S. – Iran military tensions, rising oil prices and higher Treasury yields weigh on risk assets.
Bitcoin fell toward $77,000, extending its early-September weakness after gaining nearly 25% in August. Ethereum, XRP and Solana also moved lower, while total crypto market capitalization slipped to around $2.59 trillion.
The latest weakness comes after the crypto market failed to build on its strong August recovery. Investors are now watching whether the current decline remains a short-term pullback or develops into a deeper correction.
Here are the key factors behind today’s crypto market decline.
U.S. – Iran Conflict Sends Oil Higher
The immediate catalyst came from the Middle East.
The United States launched strikes against Iranian state oil tankers as tensions around the Strait of Hormuz escalated. Iran subsequently launched retaliatory attacks and threatened U.S. interests and bases in the region.
The Strait of Hormuz is particularly important for global energy markets because a significant portion of the world’s oil supply passes through the waterway.
The escalation pushed crude prices sharply higher. Brent crude moved toward $95 per barrel, while WTI approached $90, after earlier reaching even higher levels.
That matters for crypto because higher oil prices can increase inflation expectations.
If energy prices remain elevated, markets may become less confident that central banks can ease monetary policy quickly. That creates pressure on assets such as Bitcoin and cryptocurrencies, which tend to perform better when liquidity conditions are supportive.
Bitcoin briefly fell below $77,000 as the geopolitical headlines hit markets before recovering part of the decline.
The latest oil move is therefore not simply an energy-market story. It is feeding directly into expectations for inflation, interest rates and global liquidity.
Rising Treasury Yields Add More Pressure
Oil is not the only macro problem facing crypto today.
The renewed geopolitical tension has also pushed investors toward safer assets and contributed to another rise in government bond yields.
The U.S. 10-year Treasury yield climbed toward 4.8%, while markets increasingly priced the possibility of tighter Federal Reserve policy.
Higher yields can make riskier assets less attractive because investors can earn a relatively higher return from government debt.
That creates another headwind for Bitcoin and altcoins after their strong August rally.
The timing is important. Crypto had just recovered significantly from its earlier weakness, meaning some traders were already sitting on profits. Rising yields and geopolitical uncertainty provide a reason for investors to reduce risk and lock in those gains.
Crypto Market Tests a Critical $2.59 Trillion Level
The price decline is becoming more important from a technical perspective because the total crypto market capitalization is now sitting near a major support area.
The market previously failed twice, around $2.71 trillion in late August. That created a potential double top structure, with the current decline bringing the market back toward its neckline near $2.59 trillion.
This level is now particularly important.
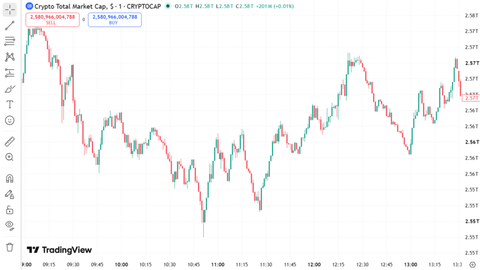
If the $2.59 trillion area holds, the latest decline could remain a normal correction following August’s strong rally.
But a decisive break below it would weaken the broader market structure and could expose the crypto market to another move toward approximately $2.47 trillion.
There is an intermediate support area around $2.54 trillion, but losing the $2.59 trillion neckline would make that level increasingly important.
In other words, the market is currently at a point where macro pressure and technical structure are reinforcing each other.
Bitcoin Long-Term Holders Provide One Positive Signal
Not every indicator is bearish.
Bitcoin’s HODLer Net Position Change recently turned positive, reaching approximately 4,710 BTC after four consecutive weeks of negative readings.
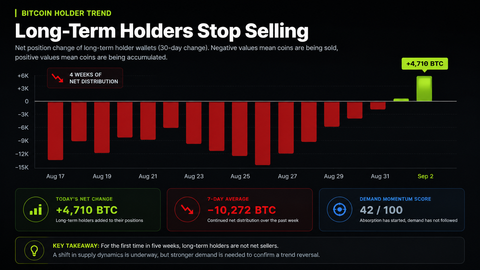
The metric tracks whether long-term Bitcoin holders are increasing or reducing their positions. A positive reading suggests that long-term holders have started accumulating again rather than consistently distributing coins.
However, the broader picture remains mixed.
The seven-day average is still around -10,272 BTC, while Bitcoin’s demand score sits at approximately 42 out of 100.
That suggests long-term holders may be beginning to absorb supply, but fresh demand across the wider market has not yet returned strongly enough to confirm a new bullish phase.
This distinction matters.
Bitcoin can find support from existing holders without immediately attracting enough new buyers to push the price higher.
For now, the on-chain data provides a counterweight to the bearish macro environment, but it does not eliminate the risk of further downside.
Bitcoin’s August Rally Is Losing Momentum
Bitcoin entered September after one of its strongest monthly performances of the year.
The cryptocurrency gained nearly 25% in August, recovering sharply from its earlier weakness. But the start of September has brought a different environment, with higher oil prices, rising bond yields and renewed geopolitical risk putting pressure on risk assets.
Bitcoin’s move below $77,000 is therefore important because it shows that the August rally is struggling to carry its momentum into the new month.
The next reaction around the $77,000 area will be closely watched.
If buyers continue defending the level, Bitcoin could stabilize while the market waits for more clarity on oil prices and Federal Reserve policy.
If selling accelerates alongside another rise in yields, the broader crypto market could face additional pressure.
Coin Spotlight: Arbitrum (ARB)
While Bitcoin and major altcoins are pulling back, Arbitrum’s ARB token is showing relative strength after its sharp rally driven by activity on Robinhood Chain.
ARB surged nearly 30% around the start of September after Robinhood Chain generated record revenue. The network is built using Arbitrum Orbit technology, creating a direct economic connection between Robinhood Chain’s growth and the broader Arbitrum ecosystem.
As covered in our latest analysis, Arbitrum Holds Near $0.11 as Robinhood Chain Revenue Fuels ARB Rally, ARB is now holding near $0.11 after reaching roughly $0.12.
The Robinhood connection is the key part of the story.
Robinhood Chain generated substantial network activity and revenue, with part of its net protocol revenue flowing back to the Arbitrum ecosystem under the Arbitrum Expansion Program. That has given ARB a fresh fundamental catalyst at a time when much of the broader altcoin market is struggling.
However, ARB is not completely insulated from the broader market.
The token still needs to hold the $0.11 area to preserve its recent breakout structure. A sustained move above the recent high near $0.1195 – $0.12 would strengthen the bullish setup, while a breakdown below $0.11 could signal that broader market weakness is beginning to catch up with ARB.
The rally also needs continued Robinhood Chain activity to remain convincing. If network volumes and revenue decline sharply, the fundamental catalyst behind ARB’s recent strength could weaken.
What Comes Next for the Crypto Market?
The immediate direction of the crypto market will likely depend on whether the current geopolitical shock continues to push oil prices and bond yields higher.
The U.S. – Iran conflict has introduced a freshm earlier volatility. Further disruption around the Strait of Hormuz could keep energy prices elevated and increase concerns about inflation
That would make the Federal Reserve’s policy outlook even more important.
The next major Fed meeting is scheduled for September 15 – 16, giving markets roughly two weeks to assess incoming inflation, employment and financial-market data before policymakers meet.
For crypto traders, the immediate technical test is the $2.59 trillion total market cap level.
Holding that support would give bulls a chance to stabilize the market after August’s rally. Losing it would increase the probability of a deeper correction toward $2.47 trillion.
Bitcoin’s long-term holders provide one encouraging signal, but the still weak demand score shows that the market needs stronger fresh buying to regain momentum.
For now, the crypto market remains caught between long-term accumulation and short-term macro pressure. Rising oil prices and Treasury yields are driving today’s weakness, while the next few sessions will determine whether this is simply a pause or the beginning of a larger September correction.
Source: www.altcoinbuzz.io
2 Comments
Pingback: SEC proposal could open floodgates to make America capital of digital cash – xpertsstudio
Pingback: Experienced Analyst Claims There Is a Bullish Signal for Cardano (ADA) and Ripple (XRP) – xpertsstudio