

Don't want to trade it yourself?
Our desk runs DEX portfolios on profit share.
The Solana price prediction for September 2026 remains bullish while $SOL holds the $103 area and trades above its major moving averages. A break above $123 and $132 could open a move toward $150, while a loss of $103 would expose support at $94.40 and $85.79.
Solana Price Analysis Tests the $103 Breakout Level
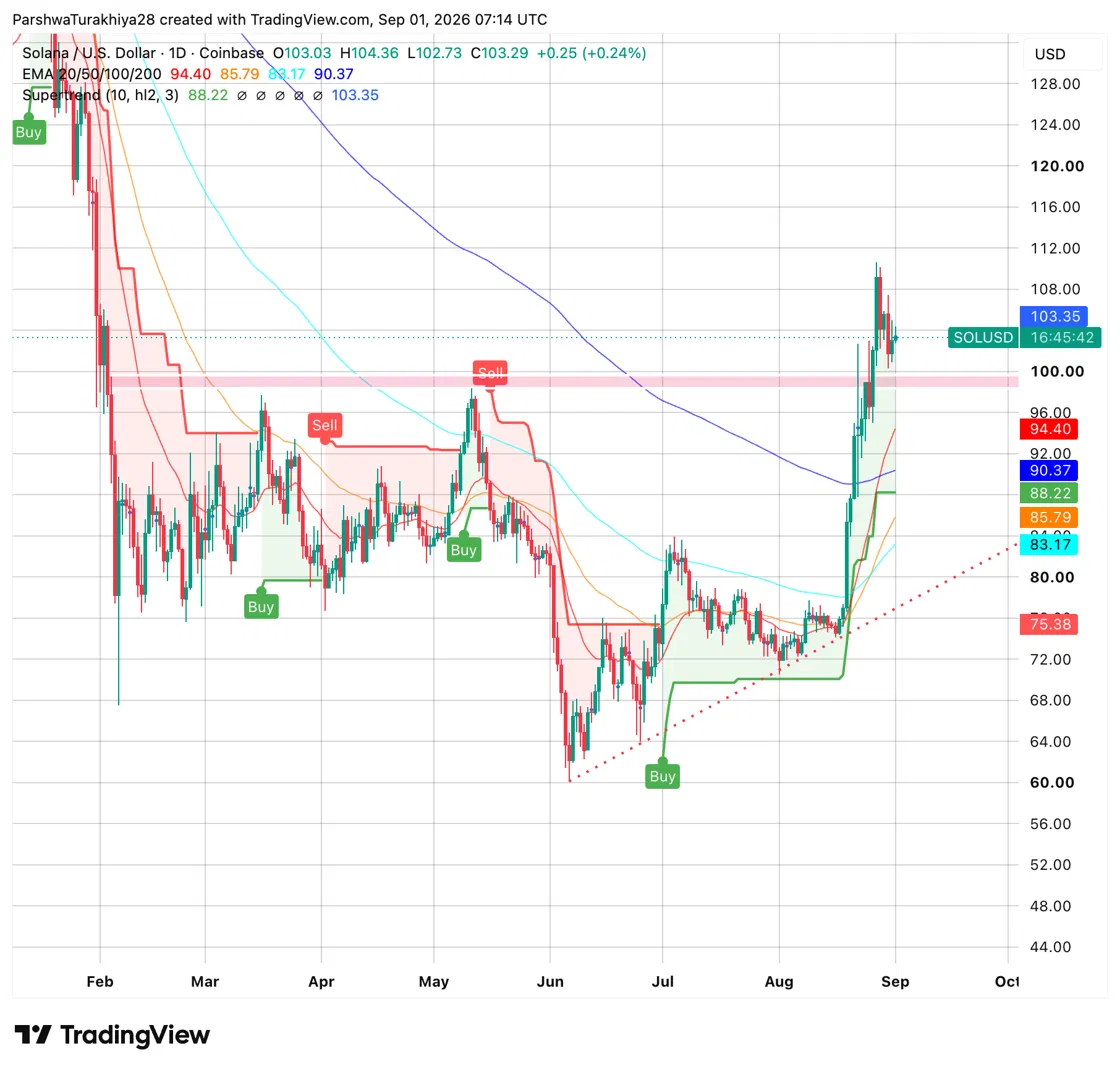
$SOL trades at $103.29, up 0.24%, sitting just above the Supertrend level at $103.35 after breaking out from the low $70s in late August. That move followed a multi-month grind between roughly $60 and $100 that ran from June through mid-August.
The EMA structure has turned bullish since the breakout. The 20-day EMA at $94.40 and 50-day at $85.79 both sit well below price and are climbing, while the 100-day at $83.17 and 200-day at $90.37 confirm the shift. An ascending trendline from the June low near $60 backs up the same picture: this move is building on a longer base, not coming out of nowhere.
$SOL Support and Resistance Levels, September 2026
Solana News: Ali Charts Says New Leg Up Has Begun, Targets $150
Analyst Ali Martinez said Solana averaged 9.5 million new addresses per day during the past week, indicating a sharp increase in network participation.
The number of wallets holding at least 10,000 $SOL rose 1.58%, with 52 new whale wallets joining the network. Meanwhile, exchange supply fell 4.91% after users withdrew approximately 2.6 million $SOL.
Moreover, Martinez identified $103 as the main support because holders previously acquired about 39 million $SOL near that price. The next cost-basis barriers sit at $123 and $132, where investors acquired approximately 20 million $SOL at each level.
Holding $103 would preserve the setup, but $SOL must clear both overhead zones before $150 becomes a confirmed technical target.
Solana News: $SOL ETFs Post Best Week Since October 2025
$SOL ETFs pulled in $153.87M for the week ending August 28, the strongest week since the week of October 31, 2025, which saw $199.21M in inflows
That performance extended a run of seven consecutive weeks of net inflows, with last week alone attracting more than 1.2 million $SOL, worth approximately $120 million
Solana News: Solana Tops All Chains in RWA Net Inflows
Solana ranked as the top blockchain for real-world asset net inflows over the past 30 days, pulling in $229 million as of August 31, ahead of Stellar at $179 million and Aptos at $137 million
Ethereum posted the largest net outflow in the same period at $453 million, followed by BNB Chain at $368 million and Avalanche at $245 million. The data excludes stablecoins.
Solana News: OpenSea Adds Solana $NFT Support
OpenSea added support for Solana NFTs on August 31, letting collectors discover, buy, and sell Solana-based collections alongside the more than 25 other blockchains already available on the platform.
Popular collections available at launch include Claynosaurz, Mad Lads, Collector Crypt, and Phygitals. OpenSea CEO Devin Finzer said the goal is making the platform a single destination for collectibles regardless of which chain they live on, removing the need to switch wallets or visit separate marketplaces.
Solana Derivatives: Volume Cools as Shorts Take the Bigger Hit
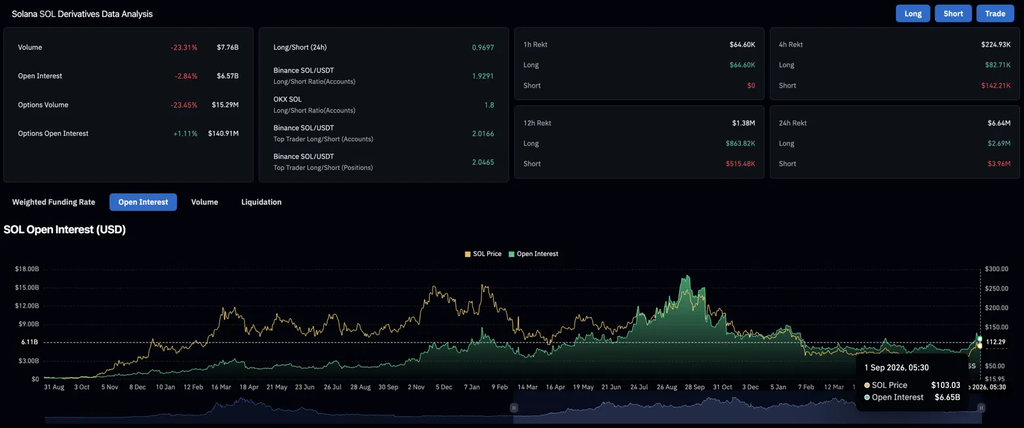
$SOL derivatives volume fell 23.31% to $7.76 billion, meaning traders exchanged fewer futures contracts over the past 24 hours. Open interest also dropped 2.84% to $6.57 billion, showing that traders closed some existing positions instead of placing new bets after the recent rally.
However, the remaining traders still favored higher prices. Binance recorded roughly 1.93 long accounts for every short account, while OKX reported a ratio of 1.8. Short sellers also lost $3.96 million in liquidations, compared with $2.69 million for bullish traders.
The data shows that sentiment remains bullish, but lower trading activity suggests the rally needs fresh participation to continue.
$SOL Price Prediction September 2026: Upside and Downside Targets
Bullish Case, Target: $150
$SOL holds the $103 support zone through early September and clears both the $123 and $132 resistance levels flagged by Ali Charts. Continued strength in ETF inflows, falling exchange supply, and Solana’s lead in RWA inflows all support the case for the breakout extending toward $150.
Bearish Case, Risk Level: $85.79 (50-Day EMA)
$SOL loses the $103 support zone, undoing the accumulation structure Ali Charts identified and exposing the broader seasonal weakness that typically hits crypto markets in September. A slowdown in ETF inflows after seven straight positive weeks, combined with renewed selling pressure, would send price back toward the 50-day EMA at $85.79.
Expert Insight
ETF inflows, RWA growth and falling exchange balances support $SOL through different channels. ETFs create direct investment demand, while RWA inflows increase network activity without necessarily buying $SOL. The stronger supply signal comes from the 2.6 million $SOL withdrawn from exchanges, since fewer available tokens could amplify price gains if ETF demand continues.
Solana Price Prediction FAQs
What is the Solana price prediction for September 2026?
$SOL could rise toward $150 if it holds $103 and breaks above $123 and $132. Losing $103 would increase the risk of a decline toward $94.40 or $85.79.
Can Solana reach $150 in September?
Solana could reach $150 if buyers clear the major resistance zones at $123 and $132. Continued ETF inflows, falling exchange balances and strong network growth would support that move.
Why is $103 important for Solana?
Around 39 million $SOL were previously acquired near $103, making it a major support zone. Holding this level would show that buyers remain willing to defend the recent breakout.
Are Solana ETF inflows bullish for $SOL?
ETF inflows show growing investor demand for Solana exposure. $SOL ETFs attracted $153.87 million during the latest week, while CoinGlass tracks continued growth in Solana ETF holdings and flows.
Source: cryptonews.net