


Don't want to trade it yourself?
Our desk runs DEX portfolios on profit share.
Currencies38935
Market Cap$ 2.72T+0.13%
24h Spot Volume$ 31.48B+34.7%
DominanceBTC57.80%+0.34%ETH10.84%-0.52%
ETH Gas0.49 Gwei
News
Aug 31, 2026
2min read
bySohrab Khawas
forCoinpedia
<img src="https://xpertsstudio.com/wp-content/uploads/2026/08/Ahead-of-the-Yearly-Close-Here-Are-Targets-for-BTC-ETH-and-XRP-the-Top-10-Cryptos-for-Q1-2025.jpg" alt="Bitcoin, Ethereum and XRP Price Prediction: Where Prices Could Move Next” loading=”lazy”>
Bitcoin risks a short-term pullback after an overbought rally with liquidity concentrated at $76,400–$76,800 (key $76,600), resistance at $80,000–$82,000 and support around $73,000–$75,000 while the weekly SuperTrend remains red and needs a close above ~$80,000 to flip green. Ethereum stays technically intact above the $2,400 breakout (watch $2,300) and XRP is testing $1.30–$1.40 support with a break below $1.30 exposing $1.13, signalling cooling crypto market momentum and mixed token performance despite a constructive higher‑timeframe structure.
See what traders are focused on
Bitcoin price today is facing a potential short-term pullback after its recent rally pushed the market into overbought conditions. The price is currently moving sideways, while traders watch the $76,400–$76,800 area for a possible liquidity sweep.
Bitcoin’s weekly Super Trend indicator remains red. The latest weekly candle closed below the roughly $80,000 level needed to flip the indicator back to green and confirm a broader bullish signal.
On the three-day chart, BTC price continues to face resistance between $80,000 and $82,000. Support remains around $73,000–$75,000.
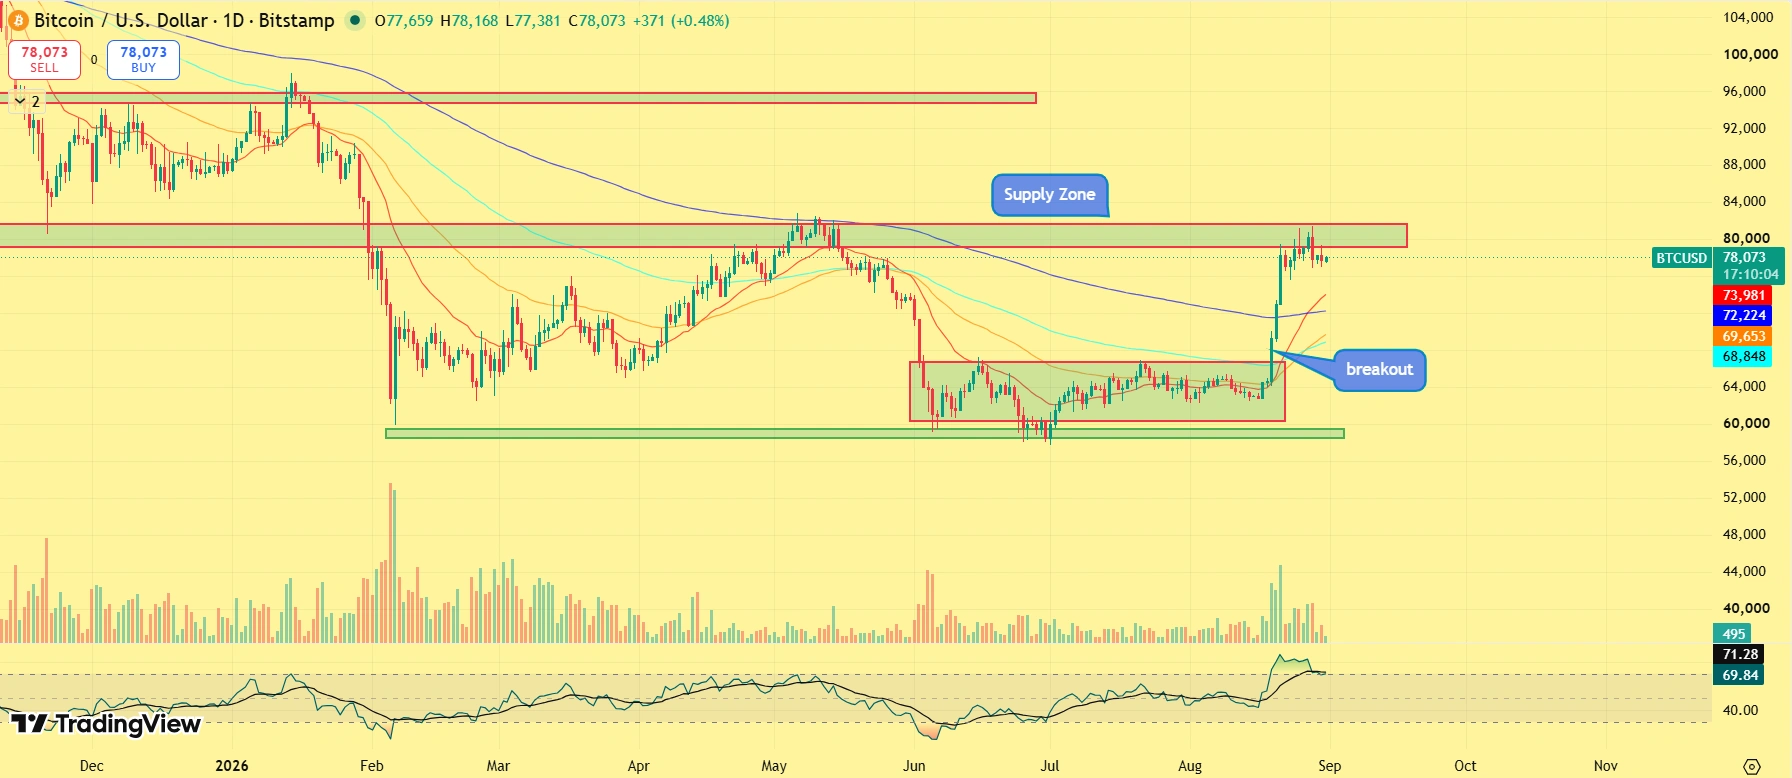
The recent slowdown follows a sharp bullish move that pushed Bitcoin into overbought territory on the daily Relative Strength Index (RSI). The current consolidation is allowing the RSI to reset and could create more room for another move higher if the broader bullish structure remains intact.
Bitcoin Could Test $76,600 Liquidity
Bitcoin recently attempted to reach downside liquidity on the liquidation heat map but fell short. The key liquidity zone is currently concentrated around $76,400–$76,800, with approximately $76,600 emerging as the level to watch.
A move toward this area would represent a short-term pullback rather than a major trend reversal. Bitcoin could also continue trading sideways as bullish momentum cools.
The broader trend remains more constructive on higher time frames, where the current pullback would have a relatively limited impact on the larger price structure.
Ethereum Holds Above Key Breakout Area
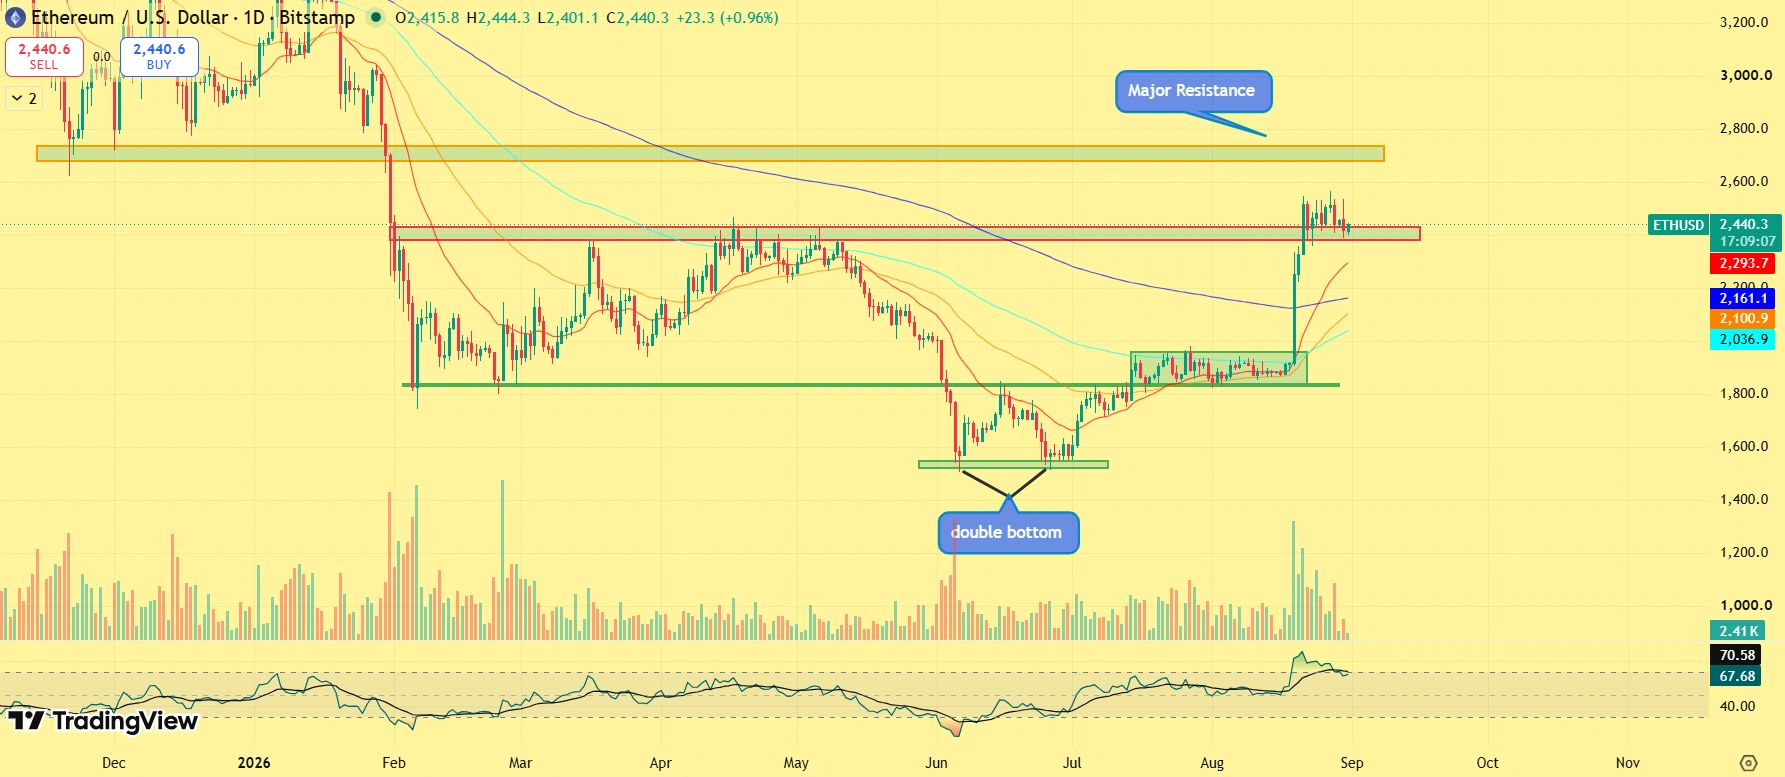
Ethereum price is following a similar pattern to Bitcoin. ETH previously broke above the $2,400 resistance area and remains slightly above that level despite recent weakness.
The breakout remains technically active as long as Ethereum avoids a confirmed three-day close below $2,400, with $2,300 representing another important level to monitor.
Like Bitcoin, Ethereum is currently cooling off after its recent rally rather than showing signs of a major breakdown.
XRP Tests $1.30–$1.40 Support
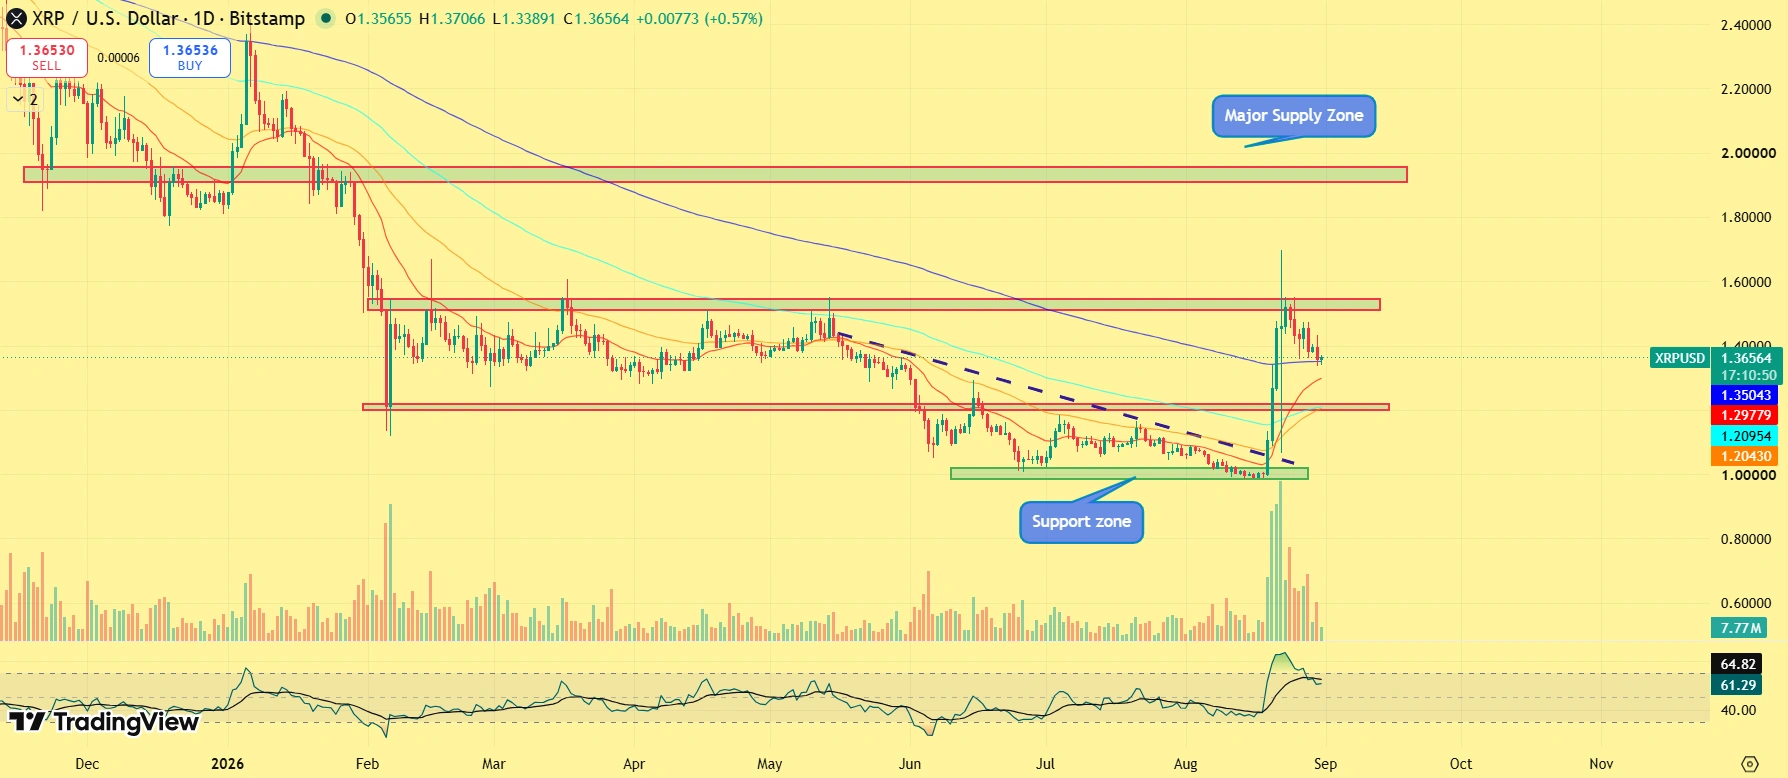
XRP price is pulling back toward the $1.30–$1.40 support zone after becoming overbought during its recent rally.
Holding this area will be important for maintaining the current structure. A confirmed break below $1.30 could expose XRP to further downside, with the next potential support around $1.13.
The daily chart shows XRP continuing to reset from overbought conditions. Continued sideways movement or a modest pullback could allow the RSI to return to more neutral levels before another potential move higher.
Source: cryptorank.io