

Close Menu
xpertsstudio

    Subscribe to Updates

    Get the latest creative news from FooBar about art, design and business.

    What's Hot

    XRP Price Prediction: Veteran Trader Says XRP Could Be Forming a Major Bottom | News

    August 29, 2026

    Crypto’s Next Battle for Attention: Bitcoin’s Market Power Meets Ethereum’s Utility as Apeing’s Crypto Whitelist Ignites the Hype

    August 29, 2026

    Pepeto Announces Its DeFi Toolkit While Bitcoin Price Prediction Hits $250,000

    August 29, 2026
    Facebook Instagram YouTube WhatsApp TikTok Telegram
    xpertsstudio
    Facebook Instagram YouTube WhatsApp TikTok Telegram
    • Home
    • DeFi News
    • Altcoin News
    • Bitcoin News
    • Ethereum News
    • Crypto Business
    • Crypto Markets
    • Crypto Regulation
    • More
      • Blockchain & Web3
    xpertsstudio
    Home»Bitcoin News»Bitcoin ETF flows swing to $202M outflow as price holds near $77.5K
    August 29, 20260 Views

    Bitcoin ETF flows swing to $202M outflow as price holds near $77.5K

    EditorBy EditorAugust 29, 20261 Comment5 Mins Read
    Share Facebook Twitter Pinterest LinkedIn Tumblr Telegram Email Copy Link
    Follow Us
    Google News Flipboard
    Bitcoin ETF flows swing to $202M outflow as price holds near $77.5K
    Share
    Facebook Twitter LinkedIn Pinterest Email

    Don't want to trade it yourself?

    Our desk runs DEX portfolios on profit share.

    35% Share
    $2.5K Minimum
    Learn more

    Bitcoin traded near $77,500 on Aug. 29 after US spot Bitcoin ETFs snapped a nine-session inflow streak, while weakening capital flows and short-term technical signals kept the $76,500–$77,000 support zone in focus.

    Bitcoin price holds above $77,000 support

    According to data from crypto.news, Bitcoin ($BTC) was trading around $77,500 at the time of writing, down 2.9% over the previous 24 hours. The price briefly fell to $77,078 on Aug. 28 before stabilizing above $77,000.

    The pullback followed a failed attempt to hold above $80,000. Bitcoin reached an intraday high near $81,200 earlier in the week but faced selling pressure as traders reacted to Federal Reserve Chair Kevin Warsh’s speech at Jackson Hole.

    On the 4-hour chart, $BTC has moved below the Bollinger Band midpoint at $78,815. The upper band sits at $80,639, while the lower band has climbed to $76,992.
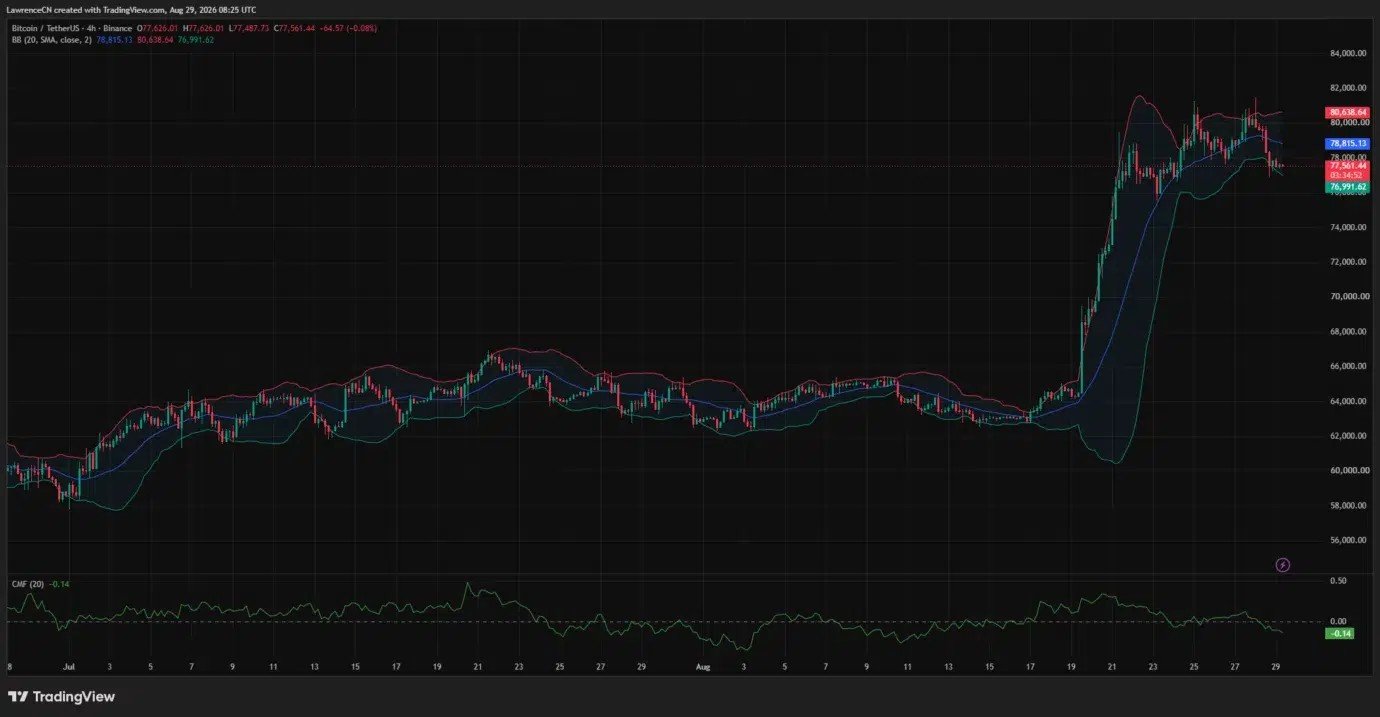
    Bitcoin price 4-hour chart — Aug. 29 | Source: crypto.news

    The lower band now overlaps with the immediate support zone between $76,500 and $77,000. Holding that area would leave room for another attempt to reclaim $78,000, while a 4-hour close below it could extend the correction.

    Bitcoin’s Chaikin Money Flow reading has fallen to -0.14. The move below zero shows that selling pressure has outweighed buying pressure during the latest decline.

    Bitcoin ETF inflows reverse after nine sessions

    According to Farside Investors, US spot Bitcoin ETFs posted $201.9 million in net withdrawals on Aug. 28. The result ended nine consecutive trading sessions of positive flows.

    ARK 21Shares’ ARKB led the outflows with $114.9 million, followed by Bitwise’s BITB with $49.7 million. BlackRock’s IBIT lost $33.4 million, while VanEck’s HODL recorded $13.2 million in withdrawals.

    Morgan Stanley’s MSBT partly offset those redemptions with a $9.3 million inflow. The other listed funds recorded no net movement.

    The change represented a $444.2 million day-over-day swing from the $242.3 million inflow recorded on Aug. 27. However, the ETF group still attracted a combined $924.5 million during the Aug. 24–28 trading week.

    The weekly total means that one negative session does not establish a longer institutional exit. Continued outflows during the next US trading sessions would provide stronger evidence that demand has weakened after Bitcoin’s sharp August rally.

    Warsh speech adds pressure to risk assets

    The ETF reversal came after Warsh said inflation remained above the Federal Reserve’s target and described broad financial conditions as difficult to call restrictive.

    In his Aug. 28 Jackson Hole speech, Warsh said the Fed’s preferred inflation measure was running at 3.7% over 12 months and 4.1% over six months. Both figures remain above the central bank’s 2% target.

    “The Fed’s predominant focus right now should be on prices,” Warsh said.

    Warsh added that the central bank must be confident that underlying inflation is returning to its target “clearly and at sufficient speed.” His comments did not commit the Fed to a rate increase, but they reduced expectations for easier monetary policy in the near term.

    The policy outlook matters for US Bitcoin investors because higher rates can raise the return available on cash and government debt. Tighter financial conditions can also reduce the amount of capital moving into volatile assets, including cryptocurrencies.

    Bitcoin indicators remain bullish on the daily chart

    Bitcoin’s broader daily structure remains stronger than its short-term setup. The daily moving average convergence divergence indicator remains positive, with the MACD line at 3,950.79 and the signal line at 3,256.24.
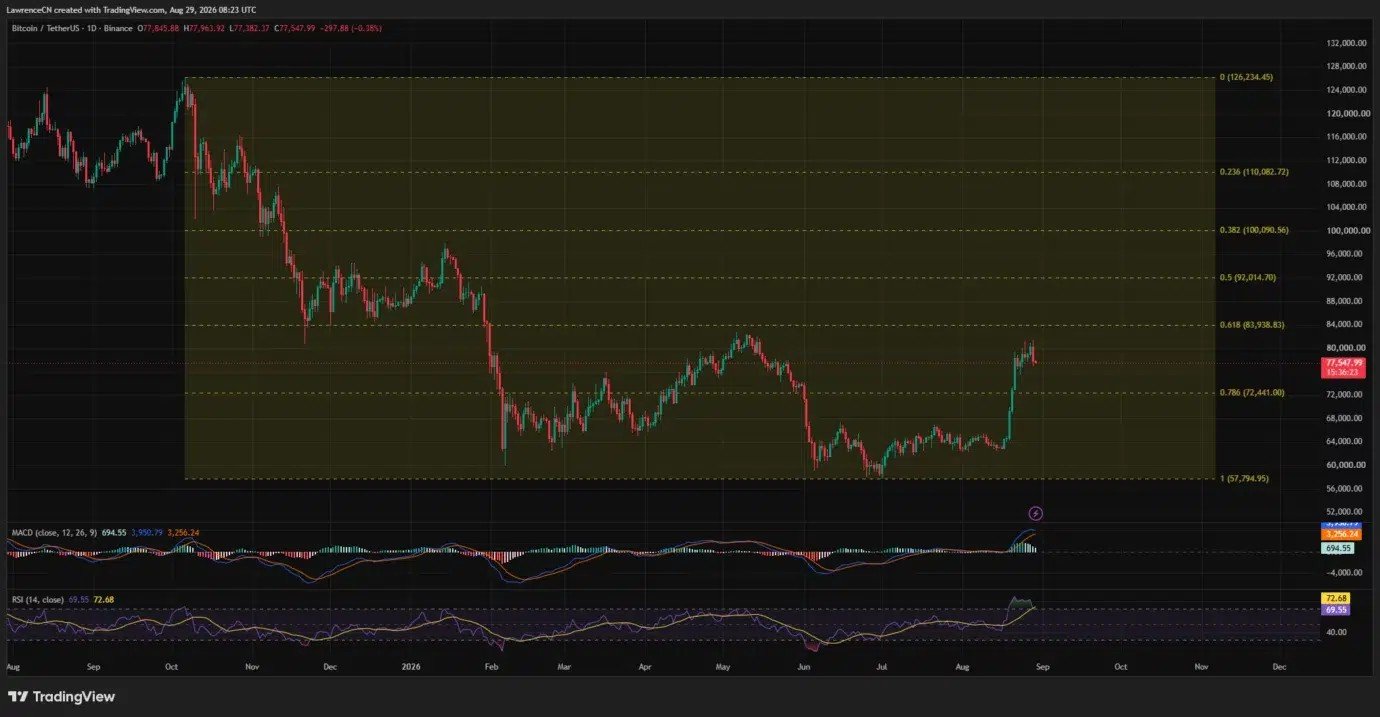
    Bitcoin price daily chart — Aug. 29 | Source: crypto.news

    The histogram remains above zero at 694.55, showing that the August rally has not produced a confirmed daily bearish crossover. However, the declining histogram bars show that upward momentum is slowing.

    The daily relative strength index stands at 69.55, just below the overbought threshold of 70. Its RSI-based moving average is higher at 72.68. The retreat from overbought territory supports the possibility of further consolidation before another sustained advance.

    A Fibonacci retracement drawn between $126,234 and $57,795 places the 78.6% level at $72,441. Bitcoin remains above that long-term level but below the next major retracement resistance at $83,939.

    The chart therefore leaves $BTC inside a broad $72,441–$83,939 range. A daily move above $83,939 would strengthen the recovery structure, while a break below $72,441 would weaken the bullish setup.

    $BTC liquidity builds on both sides of price

    The 24-hour CoinGlass liquidation heatmap shows concentrated liquidity above Bitcoin near $78,500–$79,000 and around $80,300–$80,500. Those areas may act as short-term price targets if buyers reclaim control.
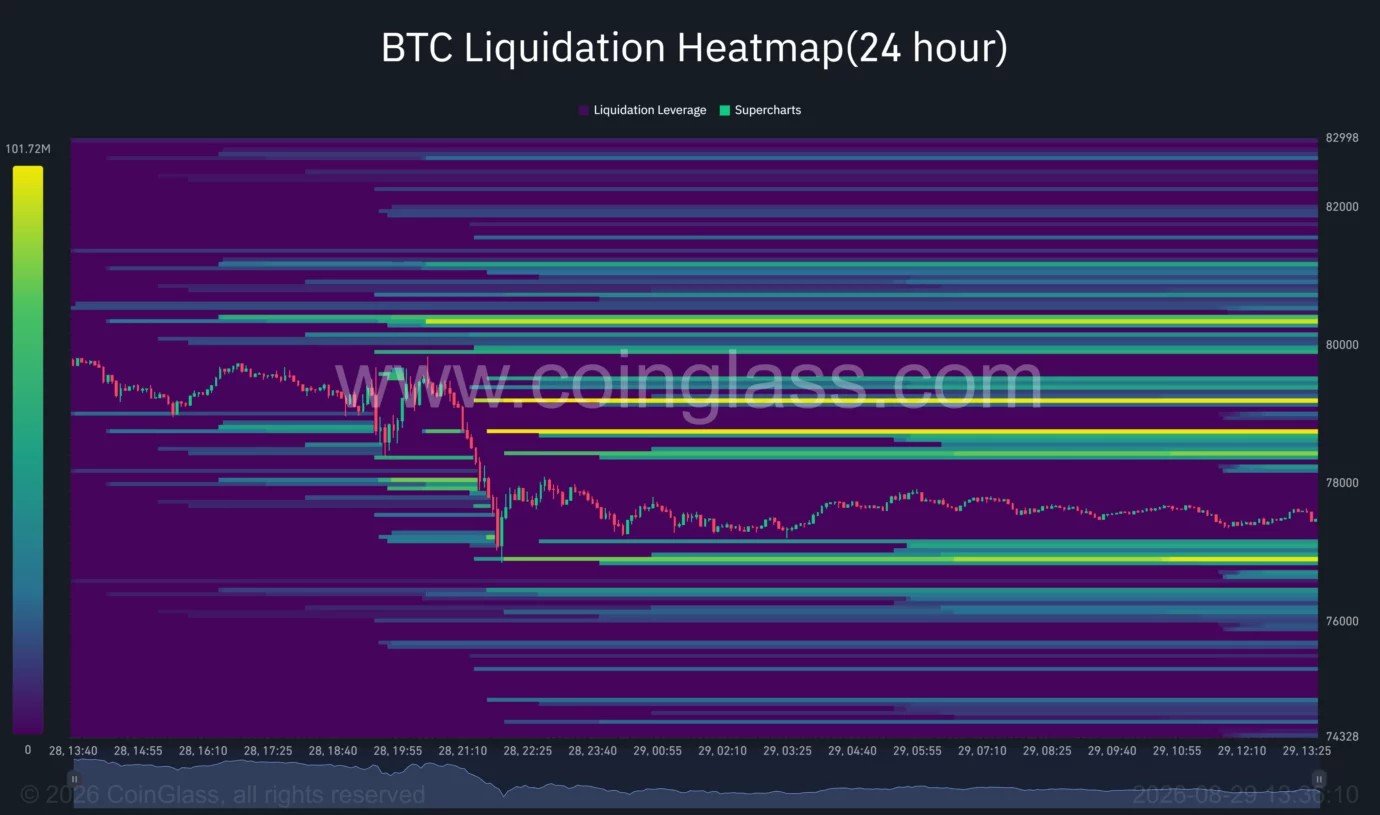
    Bitcoin liquidation heatmap | Source: CoinGlass

    A smaller but visible cluster sits below the market around $76,700–$77,000. A move through that liquidity could place the lower technical supports under pressure.

    Analyst Sheldon Diedericks said he was looking for a deeper pullback while Bitcoin remained below $84,000. His chart identified a potential buying zone between approximately $73,000 and $74,500 before a recovery attempt.

    Trader Eliz offered a similar downside map, saying Bitcoin could recover if the lower range holds. According to the analyst, a break below $75,000–$76,000 could open the way toward $71,000–$72,000, where stronger buying could emerge.

    Bitcoin must first reclaim $77,800–$78,000 to reduce the immediate downside pressure. The next resistance sits around $78,800, followed by $79,200–$80,000. A sustained move above $80,000 would weaken the current bearish structure and expose the liquidity near $80,500.

    Failure to defend $76,500 would instead place $75,700–$76,000 in view. Below that range, the analyst targets and daily Fibonacci structure converge around $72,000–$74,500, making it the main downside area to watch.

    Source: cryptonews.net

    Partner offer

    Start trading on Bybit

    Deep derivatives liquidity, tight spreads, and a deposit bonus on your first funding.

    Claim bonus
    202M Bitcoin flows outflow Swing
    Share. Facebook Twitter Pinterest LinkedIn Tumblr Email
    K
    Mentioned in this article

    KuCoin

    Spot, futures and trading bots in one account. Our link applies a fee discount at signup.

    Open account

    Related Posts

    Pepeto Announces Its DeFi Toolkit While Bitcoin Price Prediction Hits $250,000

    August 29, 2026

    Bitcoin: Oldest Coins Wake Up in 2026

    August 29, 2026

    Crypto News: Grayscale Warns U.S. Debt Crisis Could Push Investors Toward BTC, ETH, and ZEC | Market Altcoin

    August 29, 2026

    1 Comment

    1. Pingback: Bitcoin’s Oldest Coins Are Waking Up in 2026 at a Pace Rarely Seen – xpertsstudio

    Leave A Reply Cancel Reply

    Accepting new clients

    Portfolio Management

    Managed trading on centralised and decentralised markets, handled by our experienced trading desk.

    Professional crypto trading management
    Profit share 35%
    Min. capital $2,500
    Wallet Set up by us
    Execution Full service
    How the service works
    • New to on-chain trading? Our team runs it for you on a profit-sharing basis.
    • We create the wallet and place every trade — no DEX experience needed on your side.
    • The share is 35% of profit on each token traded.
    • Minimum starting capital is $2,500.
    Start DEX Management
    Profit share 00%
    Min. capital $0,000
    Custody Your account
    Execution Full service
    How the service works
    • Your funds remain in your own exchange account while our team manages the trading activity.
    • You maintain control of your account and funds throughout the management period.
    • We provide professional trading management based on the agreed strategy and terms.
    • Works with KuCoin, MEXC, Bybit and Phemex.
    • Receive a monthly report covering positions, trading activity and performance.
    CEX management terms, profit split and minimum capital are agreed in writing before onboarding.
    Apply for CEX Management

    Not financial advice. Crypto trading involves substantial risk and past results do not guarantee future returns. Capital can be lost in full. Full terms are agreed in writing before onboarding.

    Trusted Exchanges

    5

    Open an account through our partner links to claim fee discounts and sign-up bonuses.

    K KuCoin Spot & futures · trading fee discount M MEXC Widest altcoin listings · low maker fees B Blofin Copy trading · no-KYC onboarding Y Bybit Deep derivatives liquidity · deposit bonus P Phemex Contract trading · zero-fee spot plan

    Affiliate disclosure: We may earn a commission when you sign up through these links, at no extra cost to you. Trading carries risk — never invest more than you can afford to lose.

    Top Posts

    XRP Price to $0.18? Analysts Warn of Drop as Brad Garlinghouse Bets on Ripple’s Crypto Winter

    August 19, 20264 Views

    Term Finance Loses $8.5M In Ethereum Governance Attack

    August 23, 20262 Views

    🚀 Best Crypto Exchange Liquidity Provider

    August 18, 20262 Views
    0% Spot fees

    Phemex zero-fee spot plan

    Sign up with our referral code to activate the plan on a new account.

    CODE · E4G2K
    Redeem
    Most Popular

    XRP Price to $0.18? Analysts Warn of Drop as Brad Garlinghouse Bets on Ripple’s Crypto Winter

    August 19, 20264 Views

    Term Finance Loses $8.5M In Ethereum Governance Attack

    August 23, 20262 Views

    🚀 Best Crypto Exchange Liquidity Provider

    August 18, 20262 Views
    Our Picks

    XRP Price Prediction: Veteran Trader Says XRP Could Be Forming a Major Bottom | News

    August 29, 2026

    Crypto’s Next Battle for Attention: Bitcoin’s Market Power Meets Ethereum’s Utility as Apeing’s Crypto Whitelist Ignites the Hype

    August 29, 2026

    Pepeto Announces Its DeFi Toolkit While Bitcoin Price Prediction Hits $250,000

    August 29, 2026

    Stay Ahead of Crypto

    Get the latest crypto, blockchain, and Web3 news delivered straight to your inbox.

    Facebook Instagram YouTube WhatsApp TikTok Telegram
    • About Us
    • Contact us
    • Disclaimer
    • Privacy Policy
    • Terms & Conditions
    © 2026 Xperts Studio. Develop by Pro

    Type above and press Enter to search. Press Esc to cancel.