


Don't want to trade it yourself?
Our desk runs DEX portfolios on profit share.
Aster costs $0.6976 on August 29, 2026. That leaves the token around 69.8 percent below its high of $2.3076, reached on September 25, 2025, a few days after its debut, and at the same time around 79.9 percent above its low of $0.3878 on September 18, 2025. Over 30 days it is up 16.2 percent; over 90 days it is down 5.4 percent. The token ranks 39th by market capitalisation, at $1.89 billion. The question here is not a forecast but an assessment: is Aster a good buy at the current price?
The price data was collected by cryptoticker.io on August 29, 2026. The source is market data from CoinMarketCap, retrieved via the numeric identifier 36341 rather than the ticker, because ticker symbols can be assigned more than once. The basis is daily closing prices and the standard industry formulas for moving averages and the relative strength index. One caveat belongs with that: the time series covers 345 daily closes from September 18, 2025. High and low are therefore values since the debut and not quite a full calendar year.
Aster Price Analysis: Where the Price Stands and Which Levels Count
The current price of $0.6976 sits above both moving averages. The 200-day average stands at $0.6608, the 50-day average at $0.6257. The price is therefore around 5.6 percent above the long line and 11.5 percent above the short one. That is the first solid observation: Aster no longer trades in the range the market has lately treated as a fair average, but above it.
The zone between $0.62 and $0.66 is thus the level at which it will be decided whether the recovery holds. A fall back below the 50-day average is not yet a break; a fall below the 200-day average would strip the recovery of its technical basis. On the upside the next hurdle is far away: the token covered the distance to the high of $2.3076 only in September 2025 and not since.
The movement of recent weeks has been quiet: up 0.1 percent over 24 hours, up 4.6 percent over seven days. For a token of this size that is an unremarkable week, and after a decline of almost 70 percent from the high, unremarkable is not bad news.
Is the Aster Downtrend Broken or Merely Interrupted?
It is worth looking closely here, because the two moving averages tell two different stories. The price sits above both, which argues for an intact recovery. The 50-day average of $0.6257 nevertheless remains below the 200-day average of $0.6608. The short line has therefore not yet crossed the long one from below. In the language of chart analysis, the signal a trend change usually leaves behind is missing.
The price has detached itself from the low and caught up with the averages, but the averages themselves have not yet confirmed the direction. That is the condition of an interruption rather than a completed trend change. Only once the 50-day average rises above the 200-day average would the recovery be structurally established.
The assumption in this section counts as refuted if the price falls back below $0.6257 and stays there for several weeks. The movement of recent months would then have been a counter-move within a downtrend and not a bottoming out.
What RSI and Moving Averages Mean for an Aster Entry
The relative strength index stands at 63.6, in the upper part of the neutral zone. Overbought would be a reading of 70 or more, oversold one below 30. Aster is therefore neither a bargain in the technical sense nor an overheated instrument. Anyone who was waiting to enter in oversold territory missed that moment over the past year.
In practice that means two things. The timing is technically unremarkable, and unremarkable moments suit staggered purchases better than a single large entry. And an RSI of 63.6 leaves room on the upside. An RSI is, however, a momentum indicator and not a valuation: it says how fast the price has moved, not whether the price is appropriate.
What Trading Volume Reveals About Demand for Aster
Over the past 24 hours, around $105.9 million worth of Aster changed hands. Measured against a market capitalisation of $1.89 billion, that is a turnover of around 5.6 percent a day, and it is the most important difference from many another token of this size.
Why that counts: a thinly traded token can be bought at any given price but not necessarily sold at any given price. Where daily turnover runs in fractions of a percent, even a medium-sized order moves the price against its own instruction. At 5.6 percent that problem is effectively absent for private order sizes. Tradability therefore belongs among the solid arguments in favour of Aster.
Crypto exchange check: which one comes out on top? Get the most out of your entry.
Which Structural Factors Argue in Favour of Aster
Aster is the token of a decentralised derivatives exchange, that is, a trading venue for perpetual futures contracts without a central custodian. This segment has a directly comprehensibleely on the expectation of future use, here an activity can be measured that is taking place today. Anyone wanting to compare the segment will find the platforms side by side in the comparison of the best perp DEXs
The second point is the supply mechanics, and that one cuts both ways. Around 2.70 billion tokens are in circulation against a hard cap of 8 billion, or 33.8 percent. The hard cap is a positive: there is a defined final quantity. The flip side follows in the next section.
The third point is the regulatory position. In the European Union, the MiCA regulation provides a uniform legal framework for crypto assets, whose technical standards the European securities regulator ESMA publishes on an ongoing basis. Trading through regulated providers is thus more clearly governed than it was two years ago, and the counterparty risk of an exchange is easier to assess. MiCA has no influence on the valuation of the token itself; the regulation governs the providers, not the price outlook.
What Argues For Buying Aster at the Current Price
- The price sits above both moving averages. At $0.6976, Aster is above the 200-day average of $0.6608 and the 50-day average of $0.6257. The 16.2 percent gain over 30 days expresses that movement.
- Tradability is good. Daily turnover of 5.6 percent of market capitalisation means positions can be unwound again at predictable prices. Among tokens outside the top twenty that is not a given.
- The distance from the high is large. Around 69.8 percent below $2.3076 is a price that no longer contains the euphoria of the debut. That is expressly not an argument that the old peak will be reached again.
What Argues Against Buying Aster at the Current Price
- Two thirds of the supply is still outstanding. Of 8 billion tokens, 2.70 billion are in circulation; the remaining 5.30 billion or so will reach the market step by step under the release schedules. Every release increases supply without demand automatically growing with it. This is the weightiest objection, and it applies regardless of how the platform develops.
- The time series is short. 345 daily closes do not cover a full market cycle. How the token behaves in a longer downward phase has not been observed. Any statement about it is a supposition, including the ones in this article.
- The trend change is not technically confirmed. The 50-day average remains below the 200-day average. The decentralised derivatives exchange segment is also fiercely contested; a competitor with better terms can pull trading volume away quickly, and trading volume is the basis of income in this business model. For comparison, it is worth looking at Hyperliquid at its current price.
How to Buy Aster at the Current Price
The purchase runs through a crypto exchange. Which platforms list the token changes; check availability before buying rather than assuming it. An overview of fees, deposit routes and regulatory status is provided by the comparison of the best crypto exchanges; anyone who values European supervision will find the relevant providers in the comparison of regulated crypto exchanges.
On costs, three items should be kept apart: the trading fee, the spread between buying and selling price, and the withdrawal fee if you later move the token to your own wallet. With smaller tokens the spread weighs more heavily than the stated fee and rarely appears in the price list. How the providers work in detail is set out in the reviews of Bitvavo, Kraken and Bitpanda.
On custody: anyone holding larger amounts does not leave them on the exchange permanently. The basic idea of self-custody is as old as the <a href="https://bitcoin.org/bitcoin.pdf” rel=”nofollow noopener” target=”_blank”>Bitcoin whitepaper and comes down to the point that only the holder of the private key can dispose of the funds. Which devices are suitable is shown by the hardware wallet comparison. Anyone intending to hold for years should not depend on the survival of a single trading platform.
Holding Aster for longer? Then custody needs settling.
So Is Aster a Good Buy at the Current Price?
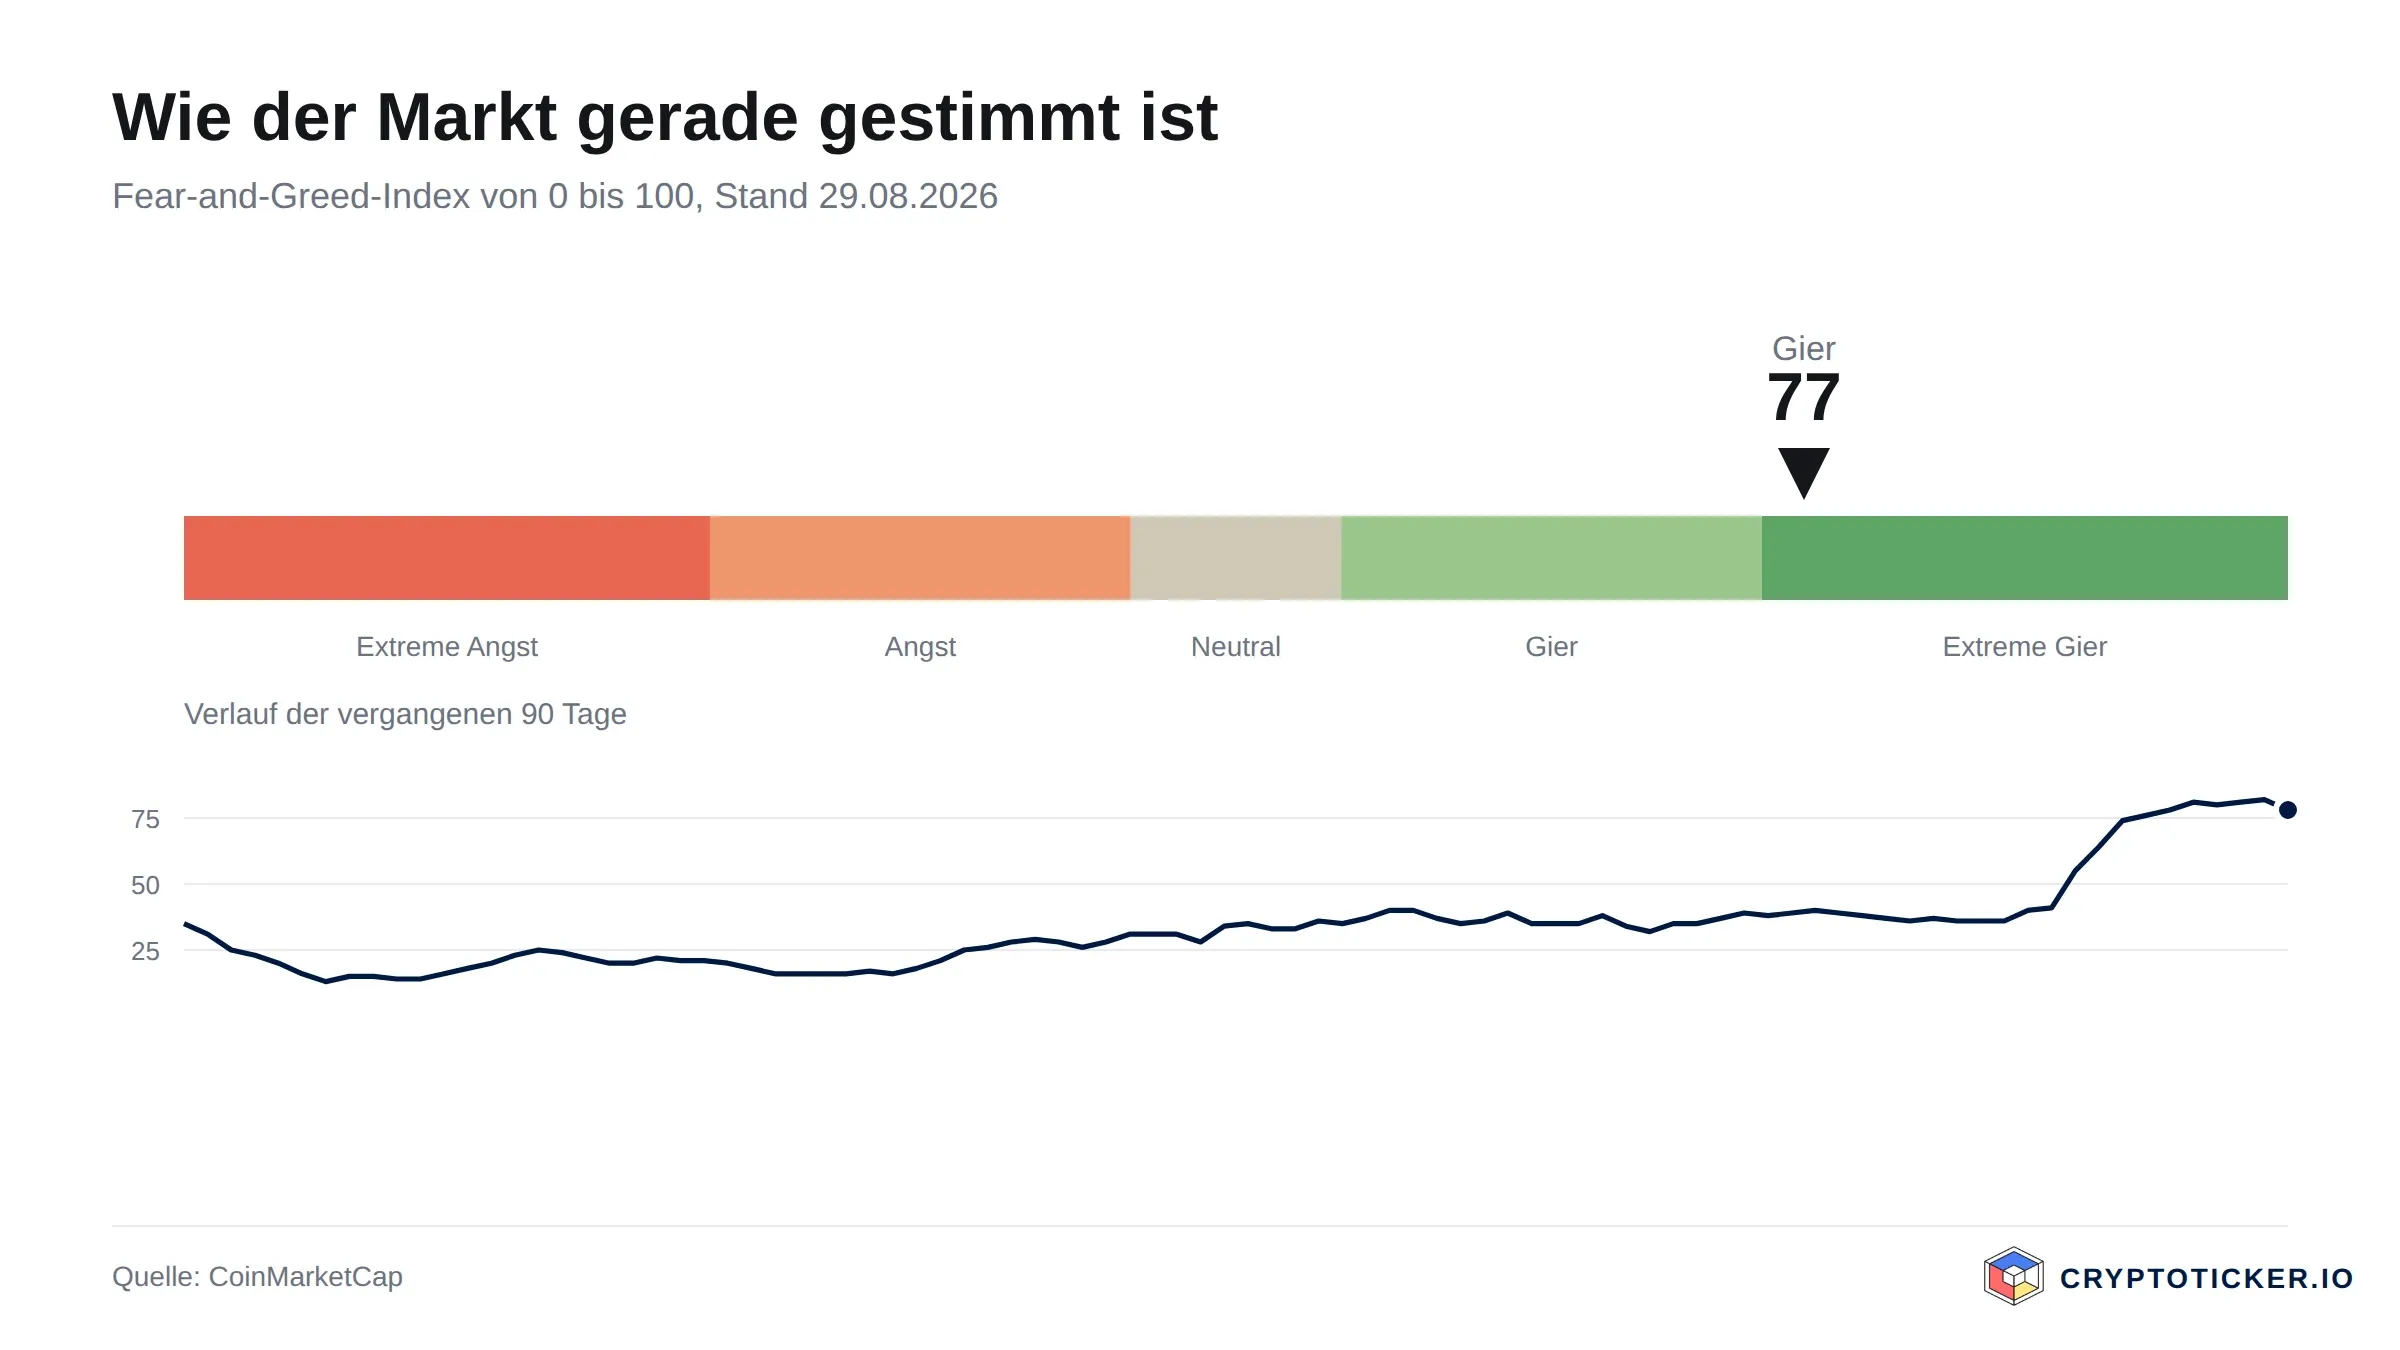
In the short term, over a horizon of weeks, the finding is neutral to mildly friendly: the price sits above both averages, the RSI of 63.6 leaves room on the upside, and tradability is good. Against that stands the fact that the 50-day average has not yet crossed the long line and that market sentiment, with a Fear and Greed reading of 76, sits in greed territory. High greed is not a sell signal, but it is an indication that a good deal of confidence is priced in. A fall back below $0.6257 would be the first sign that the short-term assumption does not hold.
In the long term, over a horizon of years, everything hangs on one question: can the platform hold enough trading volume to absorb the outstanding 5.30 billion tokens without the price giving way under the growing supply? Anyone answering yes is buying today at around 70 percent below the high. Anyone answering no is buying into a scheduled expansion of supply. The price data does not answer it; it only shows that the market currently prefers the friendlier reading.
The friendly reading counts as refuted if the price falls below the 200-day average of $0.6608 while the circulating supply rises and trading volume drops well below the current $105.9 million a day. It counts as confirmed if the 50-day average rises above the 200-day average and volume does not fall in the process.
Buying Aster: What to Take Away
- The position is a recovery without confirmation. Price $0.6976, 200-day average $0.6608, 50-day average $0.6257, RSI 63.6: above both lines, but without the crossover that would evidence a trend change. For comparison it is worth looking at Ethereum at its current price.
- Supply is the decisive reservation. 2.70 of 8 billion tokens are in circulation. Anyone buying Aster is buying a position whose circulating supply can still triple as scheduled. That belongs in every position size, unlike assets with largely issued supply such as Bitcoin at its current price.
- Tradability argues for a staggered approach. At $105.9 million of daily turnover, partial purchases spread over several weeks are possible without appreciable price impact. At a price 69.8 percent below the high and 79.9 percent above the low, that is the more sober choice than a single entry point. Which exchange suits is settled by the perp DEX comparison.
Disclosure: some of the providers named in this article work with us through partner programmes. This has no influence on the price analysis or on the assessment of the chart position; the price data comes from a public market data
(As of August 29, 2026. This article is not investment advice. Prices and fee structures change; check the terms with the provider before you buy. Crypto assets are subject to sharp price swings, and a total loss is possible.)
Transparency note: This article was produced with the assistance of artificial intelligence and reviewed by our editorial team before publication. All figures and claims were checked against the primaryI
More from CryptoTicker
Source: cryptoticker.io
3 Comments
Pingback: XRP’s Price Is Halfway Back to $3. Here’s What XRP Needs to Reclaim Its Old High – xpertsstudio
Pingback: Altcoin Season Index Drops to 33: Bitcoin Dominance Persists in Crypto Market | Market Analysis – xpertsstudio
Pingback: Phishing Site Impersonating Solana Neobank Avici Drains Over $600K from Users | Solana Security – xpertsstudio