


Don't want to trade it yourself?
Our desk runs DEX portfolios on profit share.
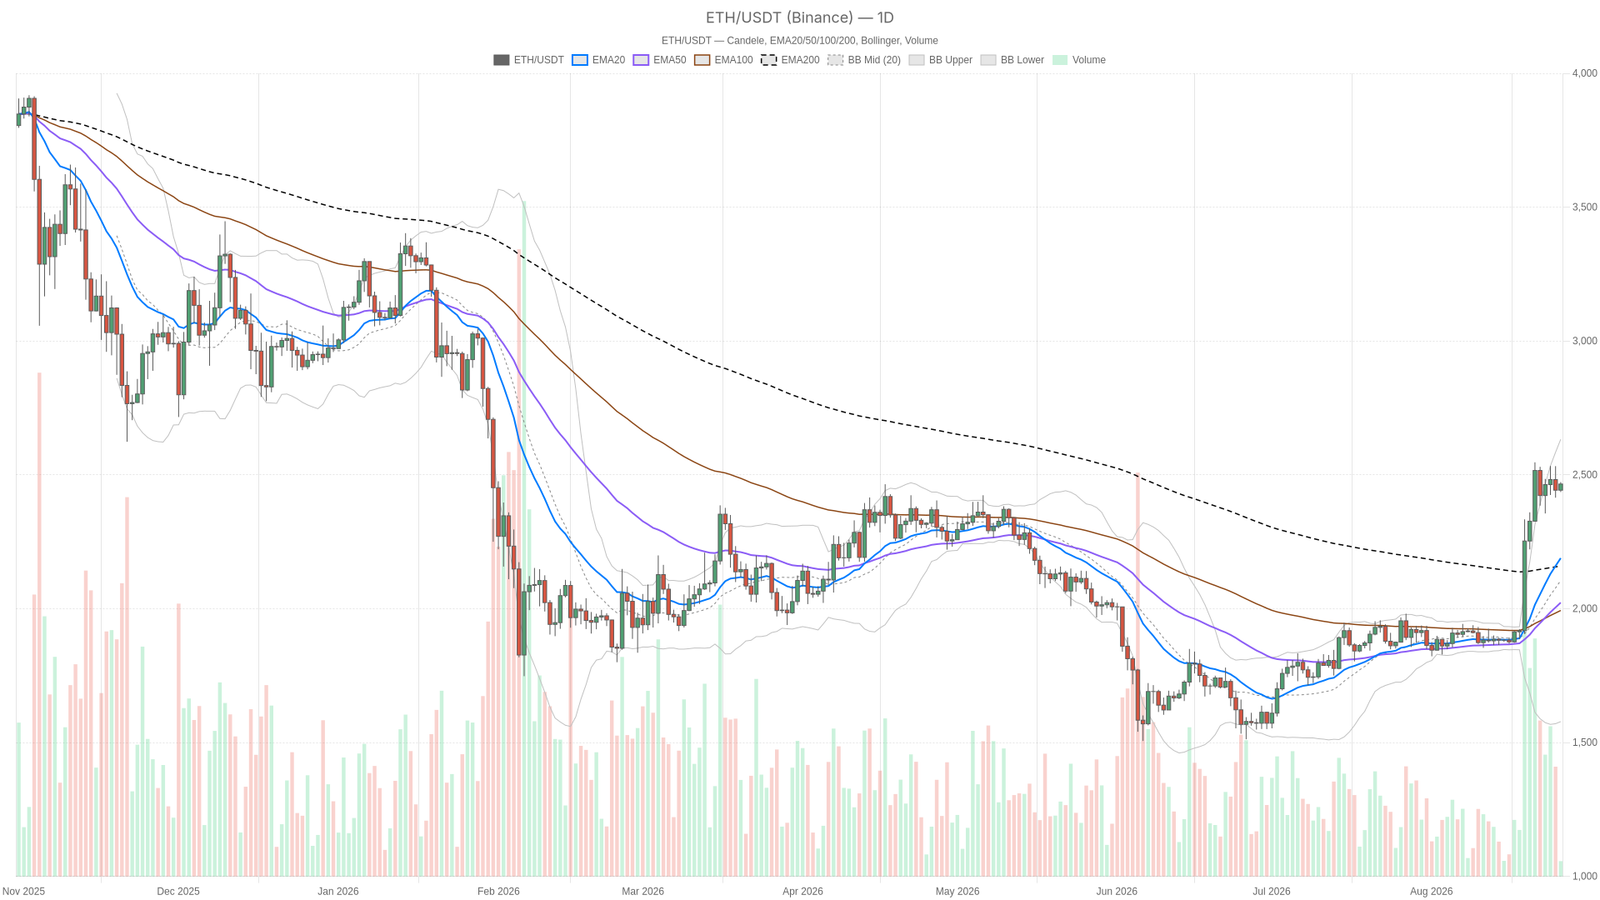
As of August 26, 2026, Ethereum price today is holding near $2,465.59, resting directly on its daily pivot at $2,458.09. The daily RSI has reached 76.06, deeply overbought, while intraday charts coil tightly beneath key resistance.
Key takeaways
- Ethereum is trading around $2,465.59 on August 26, 2026, just above its daily pivot of $2,458.09.
- The daily RSI14 has reached 76.06, a deeply overbought reading despite intact trend structure.
- Hourly and 15-minute charts show tightly converged EMAs and compressed volatility, signaling consolidation.
- Total crypto market cap fell 4.28% in 24 hours to $2.665 trillion, while Bitcoin dominance holds near 59.25%.
- The Fear & Greed Index reads 65 (Greed), even as monthly DEX fee trends remain broadly positive.
Daily Momentum Is Overheated But Structurally Intact
The daily trend remains bullish even as momentum has reached overbought levels. $ETH closed at $2,465.59, comfortably above its 20-EMA at $2,188.81, 50-EMA at $2,022.70 and 200-EMA at $2,159.21. That separation between price and all three moving averages is the signature of a real trend, not a choppy range. The market has been in a sustained markup phase long enough to pull every EMA well below spot.
The RSI14 at 76.06 confirms the strength of that move, but it is also a warning sign. Readings this high do not necessarily mean a top is in, but they do mean the easy, low-risk part of the rally is probably behind us. Chasing strength here comes with a higher probability of a sharp mean-reversion snap.
The MACD backs up the bullish case for now. The line sits at 161.07, well above the signal at 114.41, and the histogram is a healthy 46.66 and expanding. That means momentum is still accelerating rather than fading. In short, trend strength and overbought risk are both true at the same time.
The Bollinger Bands add useful context. Price is trading in the upper half of the band, with the mid-line at $2,105.40 and the upper band stretched to $2,632.77. There is room to run before price becomes overextended relative to the bands. However, with RSI already flashing overbought, that room may not get used without a pullback first. The daily ATR14 of 107.55 shows this asset has been moving with real force lately, meaning whatever happens next likely will not be a quiet grind.
Pivot levels frame the immediate battle. The daily pivot sits at $2,458.09, R1 at $2,480.36, and S1 at $2,443.31. Ethereum price today is trading just above the pivot, which keeps the short-term bias tilted toward the bulls. Yet it has not cleared R1. The next test is whether buyers push through that resistance or sellers defend it and force a retest of the pivot or S1.
1H and 15-Minute Charts: A Market Holding Its Breath
The lower timeframes are consolidating rather than trending, with price coiled tightly around converged moving averages. On the hourly chart, price at $2,465.54 sits almost exactly on top of both the 20-EMA at $2,463.10 and 50-EMA at $2,463.19. Those two averages have essentially converged, a classic sign of consolidation rather than trend. The 200-EMA at $2,326.94 remains well below price, so the broader hourly uptrend is technically intact. However, the flattening shorter EMAs mean the market has stopped making decisive progress in either direction.
The 1H RSI14 sits almost dead center at 50.39, with no directional lean at all. The MACD line is slightly negative at -3.63 against a signal of -4.99, but the histogram has flipped positive to 1.36. That hints a small bullish crossover attempt is underway even though broader hourly momentum has not fully committed.
The hourly Bollinger Bands are notably tight, with a mid at $2,461.09, upper at $2,484.86 and lower at $2,437.32. The ATR14 of just 16.76 confirms volatility has compressed sharply compared to the daily range. In other words, this is a market coiling rather than trending at the hourly level.
The 15-minute chart tells the same story in miniature. The EMA20, EMA50 and EMA200 are clustered within a few dollars of each other at $2,461.34, $2,460.81 and $2,464.02. That is about as tight as an EMA ribbon gets, a clear signal of short-term indecision. The RSI14 at 56.5 leans mildly bullish but makes no strong statement.
Moreover, the MACD histogram has slipped just barely negative at -0.15, suggesting momentum is fading intrabar even as price hovers near the pivot at $2,464.34. For execution purposes, S1 at $2,462.67 and R1 at $2,467.20 remain the tightest levels traders are likely watching.
Sentiment, Dominance, and On-Chain Activity
Sentiment still reads Greed at 65 even after a 4.28% drop in total crypto market cap. That reading is a little jarring next to the 24-hour decline. However, this divergence matters: sentiment has not caught up with the pullback in broader market cap. It can mean either that traders are looking through short-term weakness toward the daily uptrend, or that positioning is more complacent than the price action currently justifies.
On-chain activity on Ethereum’s DEX ecosystem adds nuance. Uniswap V3 fees fell 29.47% on the day but remain up 165.82% over seven days and 102.05% over thirty. Meanwhile, Uniswap V4 fees climbed 15.95% daily and are up a striking 169.95% over the past month.
Fluid DEX has been the standout, with fees up 515.69% over 30 days. Curve DEX has gone the other way, down 90.53% in 24 hours and 68.18% over the week. Taken together, the broader trend across most major venues has been one of rising usage over the past month, even if single-day numbers are volatile. That backdrop is at least directionally consistent with the bullish structure on $ETH’s daily chart.
On the news side, CNBC reported on August 25 that Bitcoin’s price extended its gains alongside moves in ether and Treasurys, underscoring a broader risk-on tone across crypto markets. Fortune’s recurring daily coverage of Ethereum’s price on August 20 and August 24 also reflects how closely mainstream financial media has been tracking $ETH’s moves in recent sessions.
Bullish Scenario
A bullish continuation requires a hold above $2,458.09 followed by a push through $2,480.36. If the MACD histogram keeps expanding and the hourly RSI climbs back above 50, the path toward the upper Bollinger Band near $2,632.77 stays open.
Confirmation would ideally come from the 1H reclaiming and holding above its own R1 at $2,470.39. That would suggest intraday buyers are finally breaking the current consolidation in the direction of the daily trend. This scenario gets invalidated if price stalls repeatedly under $2,480 while the daily RSI starts rolling over from its current 76 reading. That combination would flag momentum exhaustion rather than continuation.
Bearish Scenario
Conversely, a bearish reversal would most likely begin with a break below $2,443.31, opening a path toward the 20-EMA near $2,188.81. The counter-case starts with the daily RSI at 76.06, a level that historically raises the odds of a mean-reversion move. That risk is amplified by the broader market cap already down 4.28% over the past 24 hours.
On the hourly, losing the flat EMA20/50 cluster around $2,463 and closing beneath the lower band at $2,437.32 would confirm that sellers have taken control. This bearish case is invalidated if price reclaims the daily pivot at $2,458.09 and the 1H pushes back above $2,470 resistance. That would put the move back in bullish continuation territory.
Positioning and Risk
The current setup favors patience because the daily, hourly, and 15-minute signals point in different directions. The daily chart is trending and overbought at the same time, the hourly chart is flat, and the 15-minute chart is essentially asleep. That combination usually resolves with a volatility expansion once the pivot zone between $2,458 and $2,480 gets decisively broken in either direction.
The gap between the daily ATR14 of 107.55 and the 15-minute ATR14 of just 7.02 is worth noting. When short-term ranges compress this much while the higher timeframe remains volatile, the eventual move out of this coil tends to be sharper than recent price action suggests.
Moreover, sentiment still reads Greed despite a broader market pullback, and Bitcoin dominance holds firm rather than ceding ground to $ETH. That makes this a moment for patience over conviction. Waiting for the pivot zone to resolve is wiser than assuming either scenario has already won.
What is Ethereum’s price right now?
As of August 26, 2026, Ethereum is trading around $2,465.59, just above its daily pivot at $2,458.09.
Is Ethereum overbought at the moment?
Yes, the daily RSI14 has reached 76.06, a deeply overbought reading, even though the daily trend structure remains intact above its major moving averages.
Which levels matter most for the next move?
The daily pivot at $2,458.09, resistance at $2,480.36 and support at $2,443.31 are the immediate levels. A larger target sits near the upper Bollinger Band at $2,632.77.
Ethereum’s daily structure remains bullish above $2,458, but the overbought RSI at 76.06 and compressed intraday ranges argue for caution. A decisive break above $2,480.36 or below $2,443.31 will likely determine the next direction. Until then, the market is coiling, and the safest stance is to wait for confirmation rather than anticipate the move.
Disclaimer: This article is for informational purposes only and does not constitute financial advice, an investment recommendation, or a solicitation to buy or sell any financial instrument or cryptocurrency. The analysis provided is not indicative of future results. Investing in crypto assets and financial markets carries a high risk of capital loss. Always do your own research (DYOR) and consult a qualified financial advisor before making any decision.
Article produced with the assistance of artificial intelligence and reviewed by the editorial team.
Source: cryptonews.net