


Don't want to trade it yourself?
Our desk runs DEX portfolios on profit share.
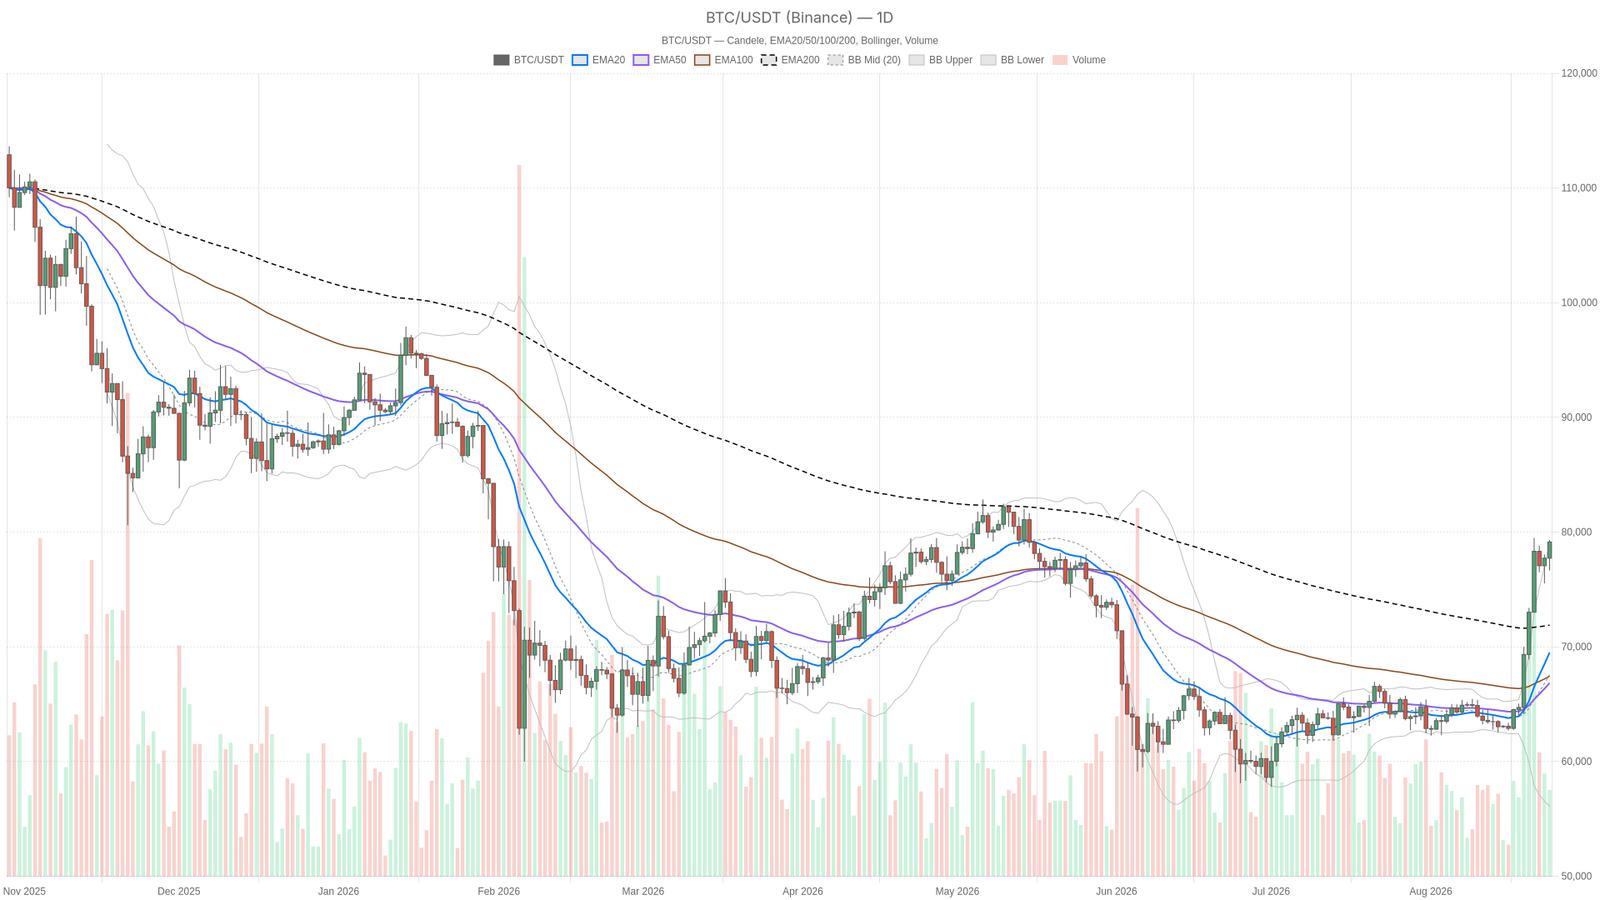
As of August 24, 2026, Bitcoin trades around $79,140, just below the psychological $80,000 mark after a roughly 22% weekly surge. The Bitcoin price now sits stretched against a daily structure that is objectively overheated, with momentum-driven risk appetite colliding against exhaustion signals.
Key takeaways
- Bitcoin surged roughly 22% in days to trade near $79,140 as of August 24, 2026.
- Daily RSI sits at 82.32, deep in overbought territory historically linked to mean-reversion pullbacks.
- A Treasury buyback operation triggered a violent short squeeze that accelerated the rally, according to Fortune.
- Bitcoin dominance holds at 58.97% of the roughly $2.7 trillion total crypto market cap, per CoinGecko.
- Fear & Greed Index reads 73 (Greed), signaling conditions where corrections tend to be sharper and faster.
Bitcoin Price Structure: Trend Strength vs. Mean-Reversion Risk
The daily structure is unambiguously bullish: price trades well above all three EMAs with expanding momentum. Yet the same chart flashes an overbought RSI at 82.32, a level that historically precedes at least a pause. This is not a quiet consolidation phase. According to Bloomberg reporting, the market ripped roughly 22% in a matter of days and is now testing the upper limits of what a trend can absorb before something has to give.
Fortune reported that traders positioned for Bitcoin to stay stuck below $67,000 got blown out in a single afternoon after a Treasury buyback operation triggered a violent short squeeze. That structural, flow-driven explanation clarifies why price accelerated: it was forced covering, not just retail FOMO. Meanwhile, Bitcoin’s market cap dominance sits at 58.97% of the roughly $2.7 trillion total crypto market cap, per CoinGecko figures, meaning capital rotation into alternatives like Hyperliquid has not pulled dominance down. $BTC is still driving the bus.
On the daily timeframe, the EMA structure confirms the trend: the 20 EMA at 69,511 sits above the 50 EMA at 66,851, which sits above the 200 EMA at 71,895, with price at 79,142 trading well above all three. However, RSI14 at 82.32 is deep into overbought territory. The daily MACD line at 3,448 versus a signal line at 1,767.95, with a histogram of 1,680.06, confirms momentum is still expanding. No bearish divergence has formed yet, which is the only factor preventing the overbought reading from becoming an immediate red flag.
The Bollinger Bands reinforce this tension from a different angle: the daily upper band sits at 79,035 with price trading essentially right at and slightly through it, while the midline sits far lower at 67,562. Price riding the upper band during a strong trend can signal continuation, but it also means any mean-reversion snap-back would have a long way to fall before finding real support. Daily ATR14 at 2,349 puts realistic swings in perspective: this market does not move in straight lines even when the trend is intact.
Momentum Still Confirms, But It’s Thinning
Shorter timeframes confirm the bullish bias without yet screaming exhaustion the way the daily does, though momentum intensity is beginning to decelerate. The 1-hour chart shows EMA20 at 77,570 above EMA50 at 77,082 above EMA200 at 72,326, a clean trend alignment with a regime tag that reads outright bullish. RSI14 at 69.56 is elevated but not yet at extremes, while the MACD histogram at 153.58 with the line above signal shows momentum remains positive, just less intense than the daily push.
On the 15-minute chart, useful only for execution timing rather than directional calls, RSI sits at 72.91 and the MACD histogram at 132.36, both leaning bullish. Price hugs the upper Bollinger Band at 78,998 and trades just under the 15m pivot resistance at 79,418.2. Immediate support on this timeframe rests at 78,815.72. However, the room for aggressive upside chasing on the smallest timeframe is thin before hitting resistance, even though short-term dips are still being bought.
Where Pivot Levels and Sentiment Line Up
The daily pivot at 78,379.5 frames the immediate battle: a close above R1 at 80,088.98 would mark a clean breakout signal, while a slip under S1 at 77,432.51 puts the overbought daily RSI thesis back in play fast. On the 1-hour timeframe, pivot resistance at 79,663.65 and support at 78,319.17 are the more tactical levels traders are likely watching intraday.
Layered on top of all this, the Fear & Greed Index reads 73, classified as Greed. It is not yet at extreme euphoria, but it sits comfortably in territory where pullbacks tend to get sharper and faster once they begin. That sentiment backdrop, combined with the overbought daily structure, makes level-watching more important than directional conviction right now.
Bullish Scenario
A daily close above the 80,088.98 resistance level, with H1 momentum holding above its 77,570 EMA20 and MACD histograms staying positive across timeframes, would give the trend legitimate room to extend. If Bitcoin price manages this, the Treasury-driven short squeeze has already demonstrated how fast this market can move when positioning gets one-sided. Moreover, if dominance keeps holding near 59% while total market cap grinds higher, capital rotation into alts is not derailing the core trend. This scenario would be invalidated by a failure to hold above the daily pivot at 78,379.5 on a closing basis, or by a bearish divergence forming between price and the daily RSI above 80.
Bearish Scenario
The bearish case rests entirely on daily RSI at 82.32 and price sitting outside the upper Bollinger Band. A move born out of a short squeeze rather than steady accumulation can unwind just as violently as it built. A break below daily S1 at 77,432.51 would open the door toward the 20 EMA at 69,511 as a realistic retracement zone, with the daily BB midline at 67,562 serving as a deeper mean-reversion target if momentum truly breaks down. However, this scenario would be invalidated if price reclaims and holds above the daily pivot at 78,379.5 with the H1 EMA20 continuing to act as support rather than resistance.
Final Read
The market is caught in a genuine tug-of-war between daily exhaustion signals and shorter timeframes that have not broken down yet. That is not a contradiction to smooth over; it is the actual state of the market. Daily ATR of 2,349 and the Greed reading on sentiment both point to a market capable of wide, fast swings in either direction. Anyone tracking this move should think in terms of levels and confirmation rather than conviction alone, sizing for the volatility this overbought-yet-trending setup tends to produce, and remembering that a squeeze-driven rally can reverse with similar speed once forced-buying pressure runs out.
Why did Bitcoin surge so quickly to $79,000?
A Treasury buyback operation triggered a violent short squeeze blowing out traders who had positioned for Bitcoin to stay below $67,000. The forced covering, rather than gradual accumulation, explains the speed and intensity of the roughly 22% weekly advance
Is Bitcoin overbought at current levels?
Yes, according to multiple indicators. The daily RSI14 reads 82.32, deep in overbought territory historically associated with at least a pause or pullback. Price is also trading at and through the upper daily Bollinger Band, reinforcing the overextended signal.
What are the key levels to watch for Bitcoin right now?
The daily pivot sits at 78,379.5, with resistance at 80,088.98 and support at 77,432.51. A daily close above resistance would be a breakout signal, while a drop below support would put the mean-reversion thesis back in play toward the 20 EMA at 69,511.
Disclaimer: This article is for informational purposes only and does not constitute financial advice, an investment recommendation, or a solicitation to buy or sell any financial instrument or cryptocurrency. The analysis provided is not indicative of future results. Investing in crypto assets and financial markets carries a high risk of capital loss. Always do your own research (DYOR) and consult a qualified financial advisor before making any decision.
Article produced with the assistance of artificial intelligence and reviewed by the editorial team.
Source: cryptonews.net